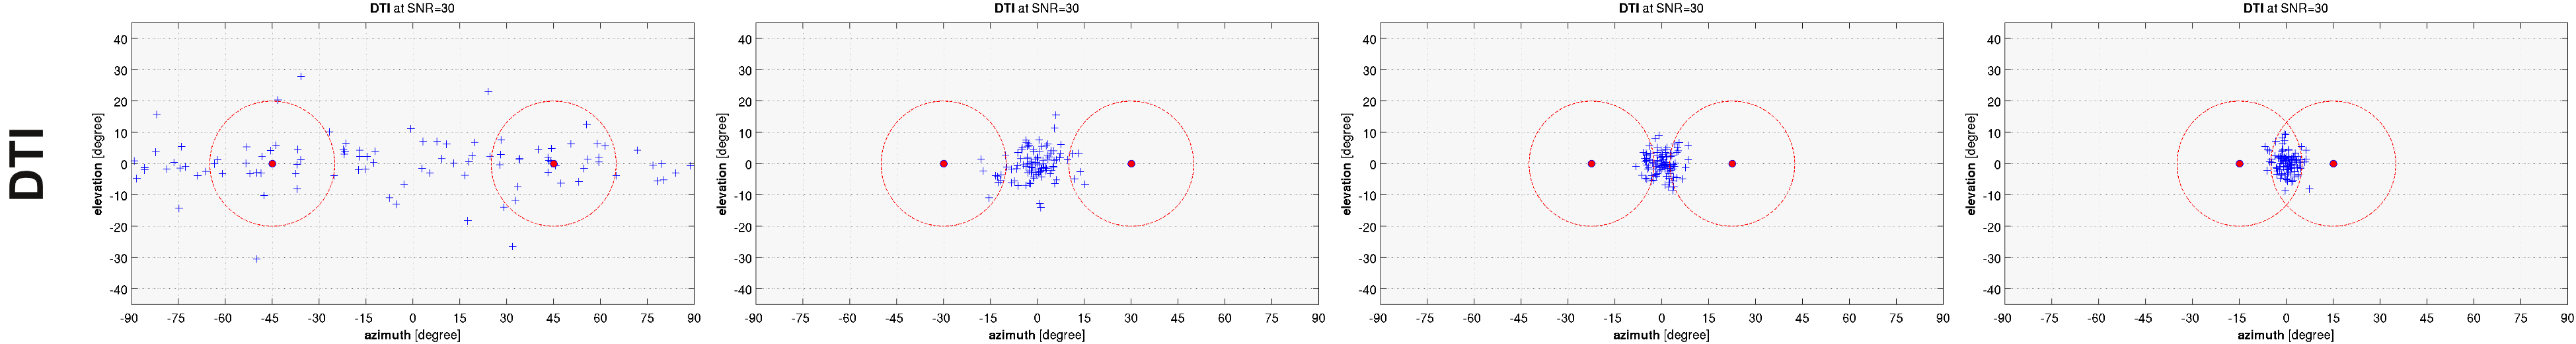
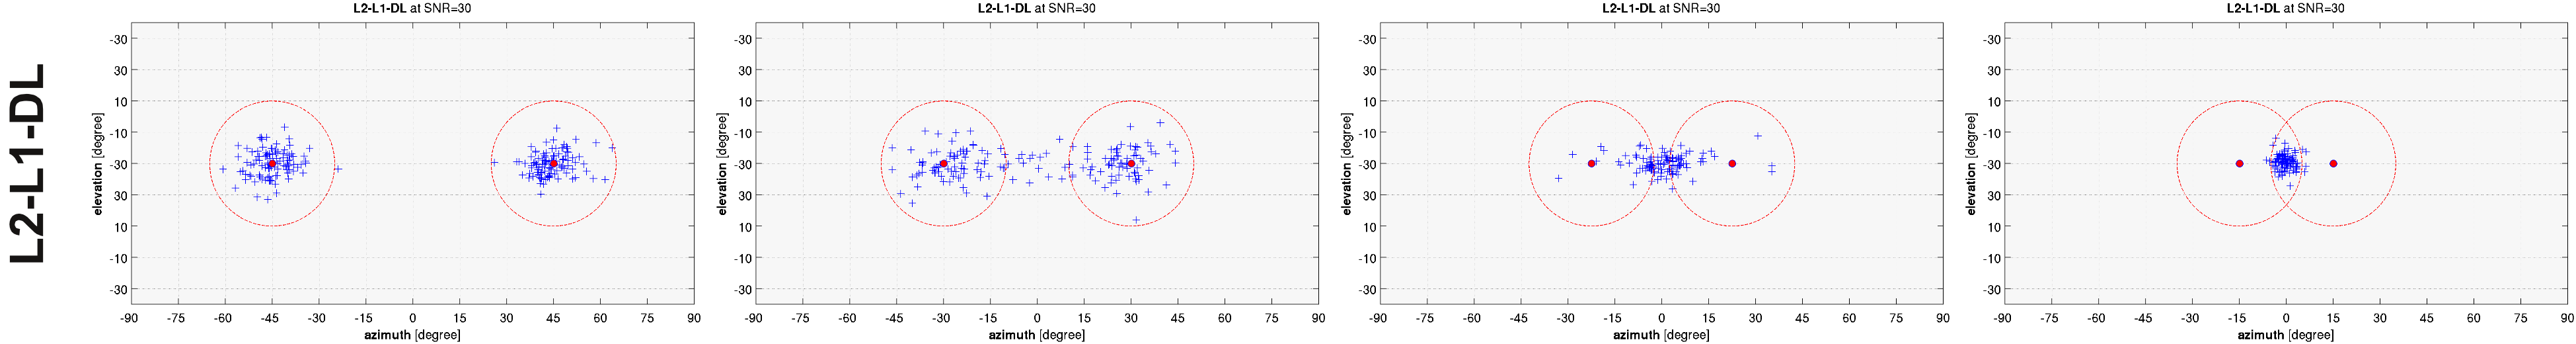
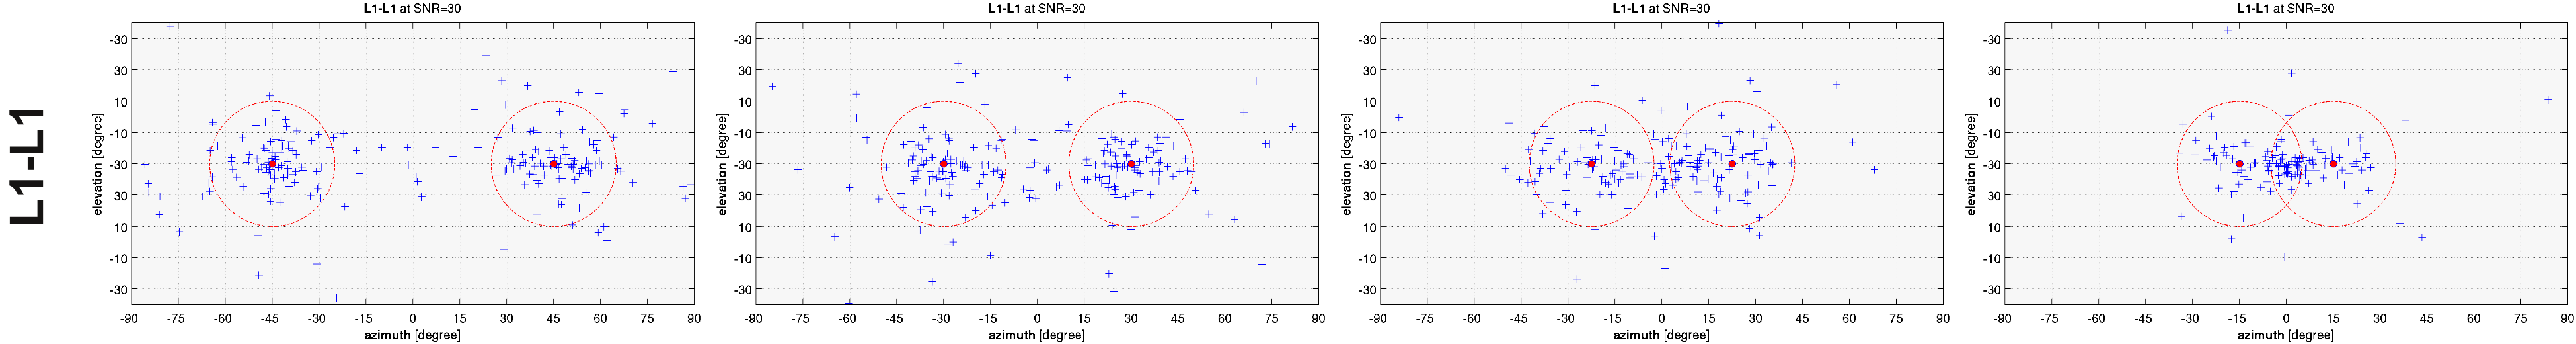
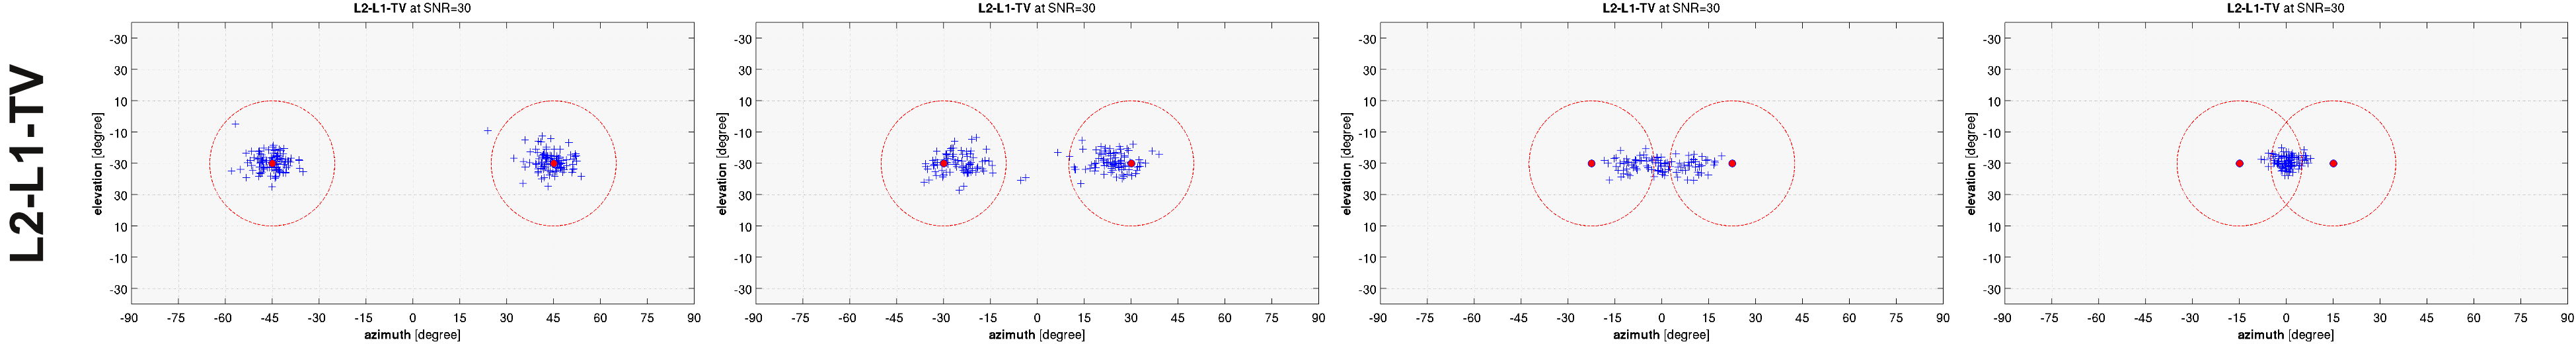
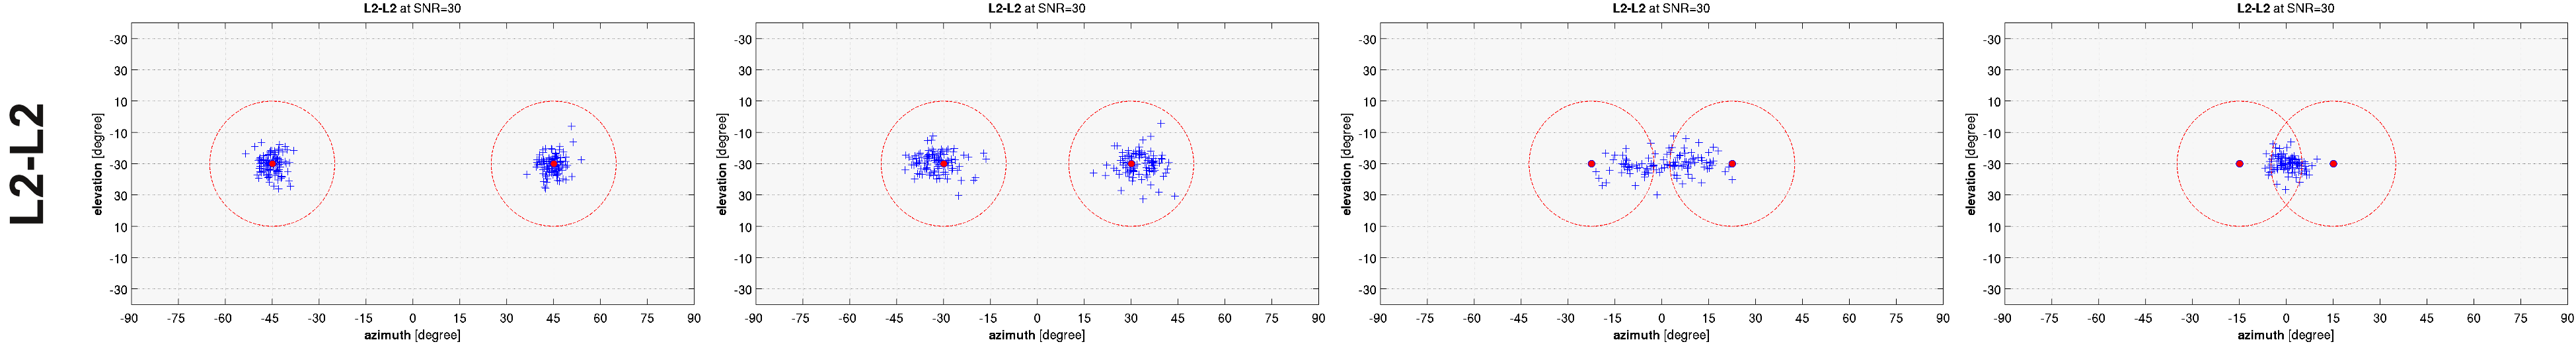
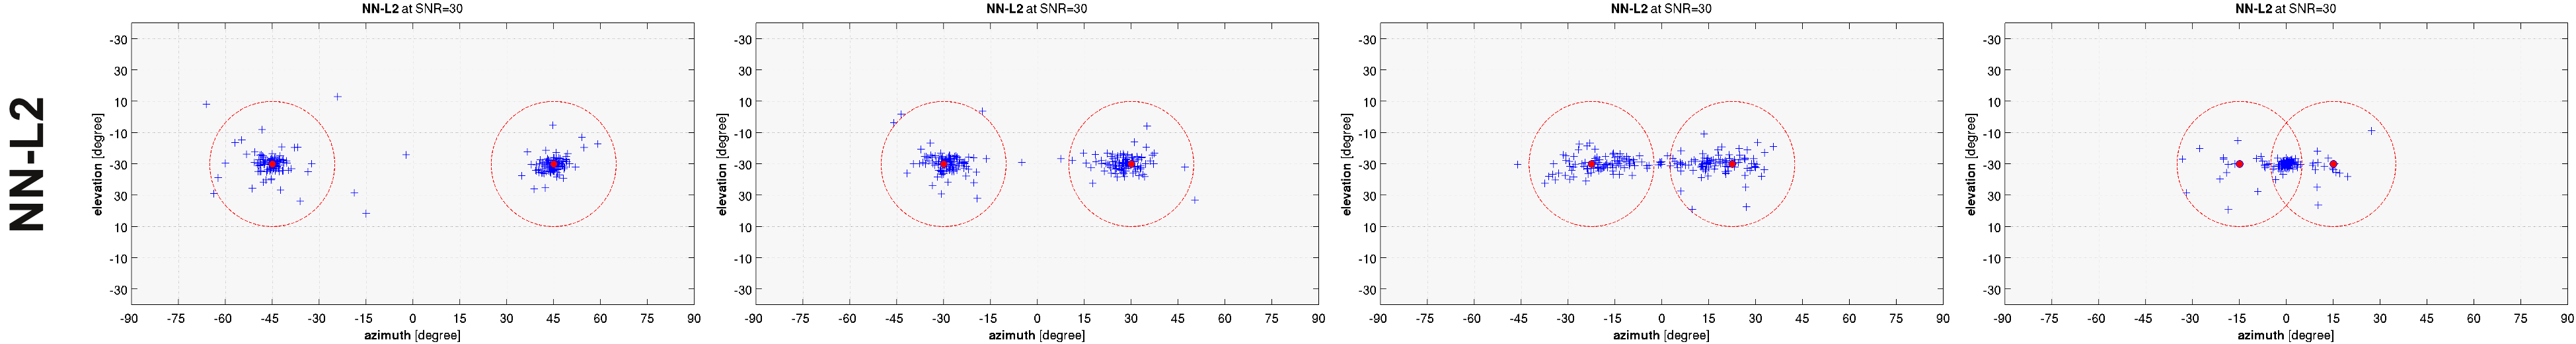
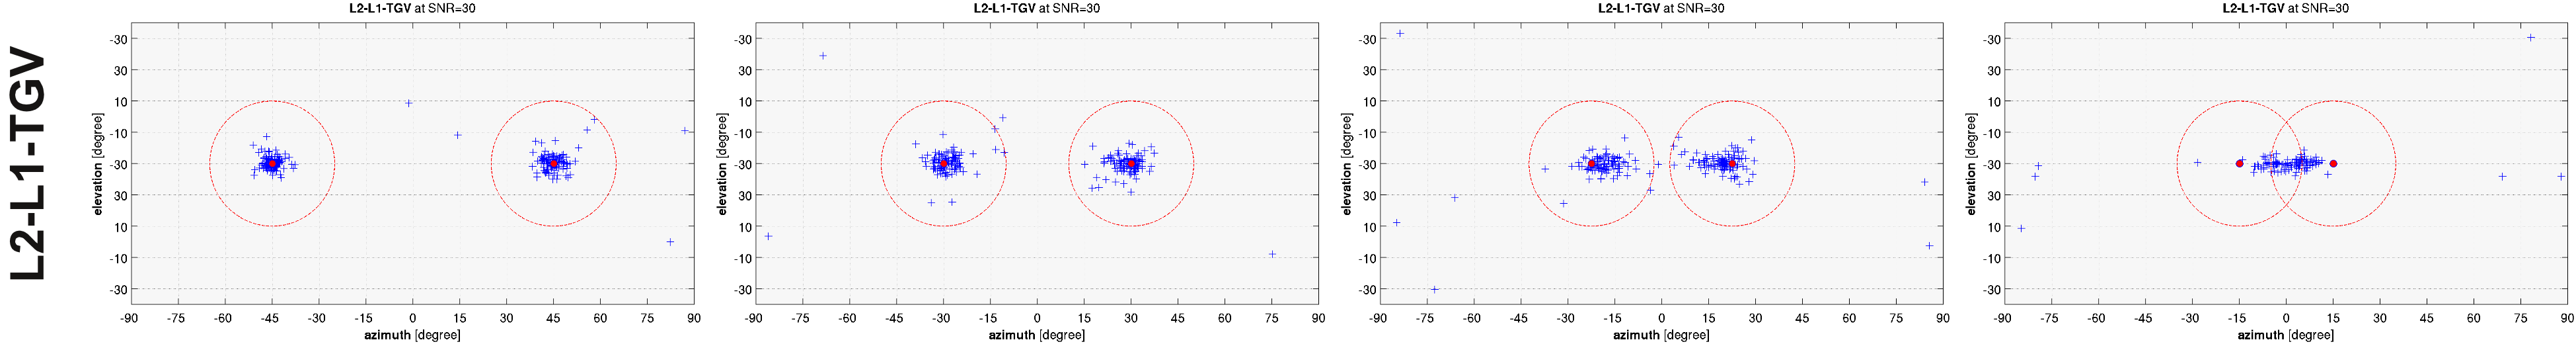
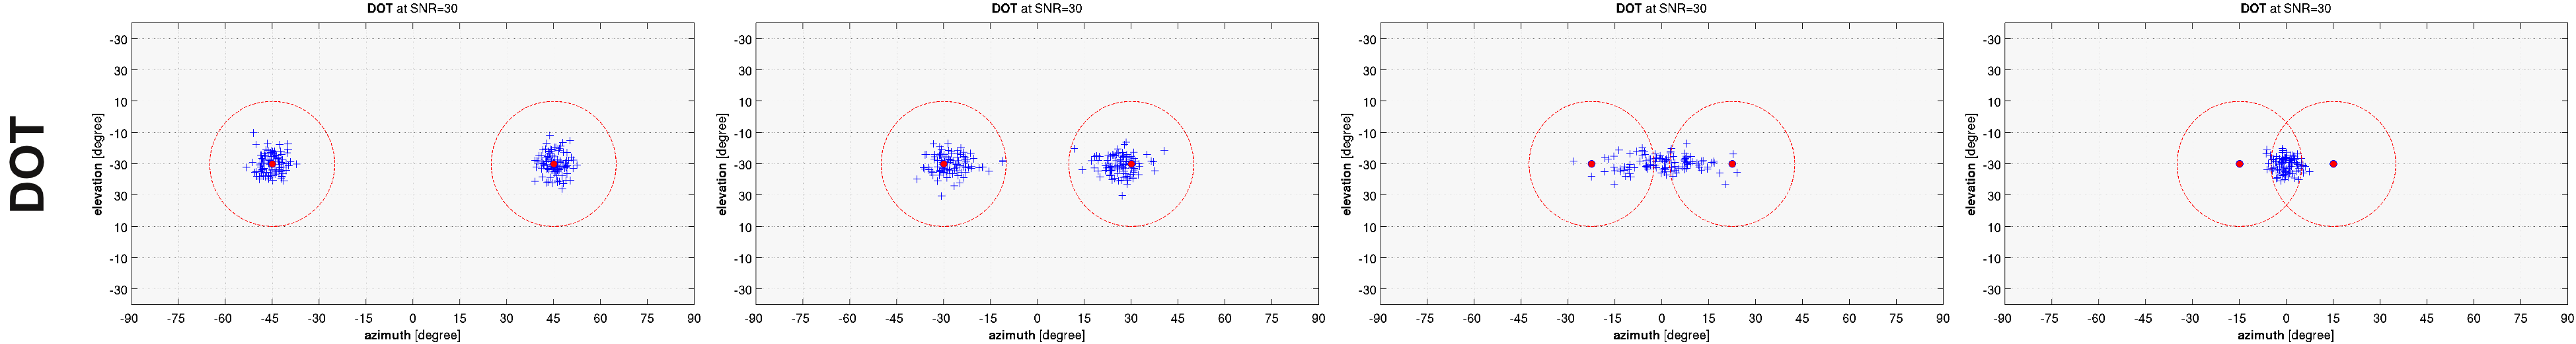
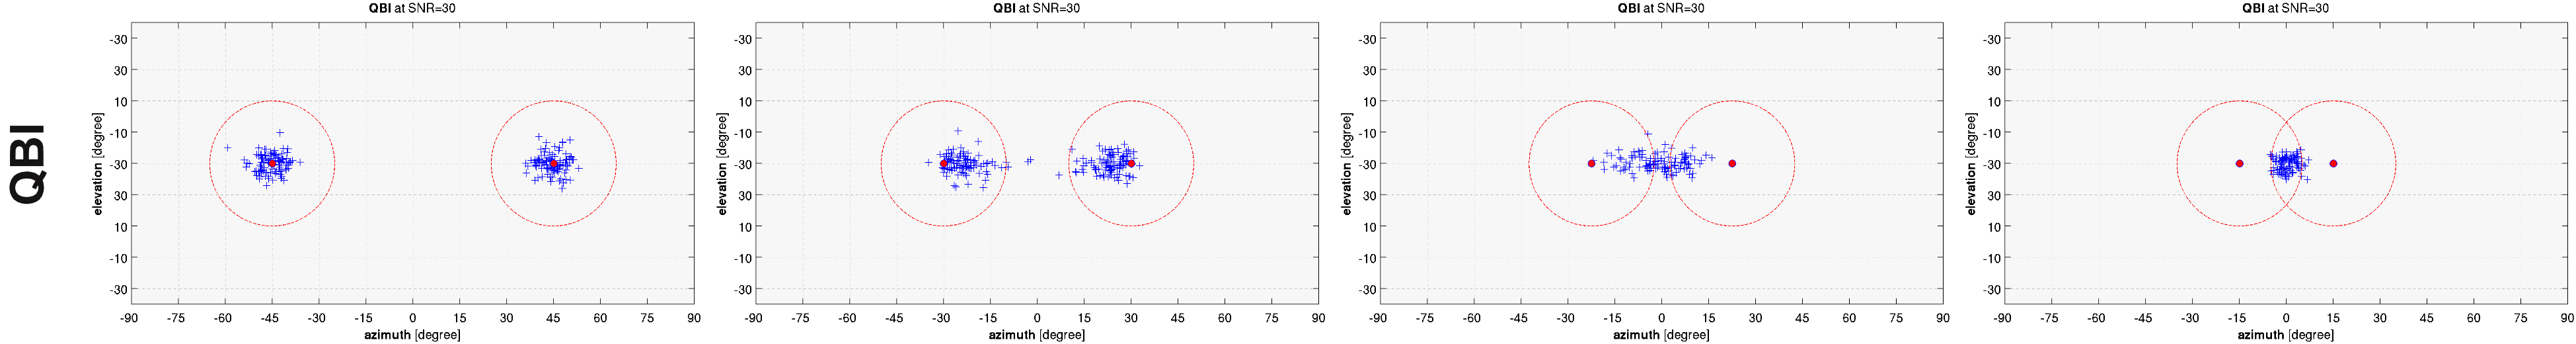
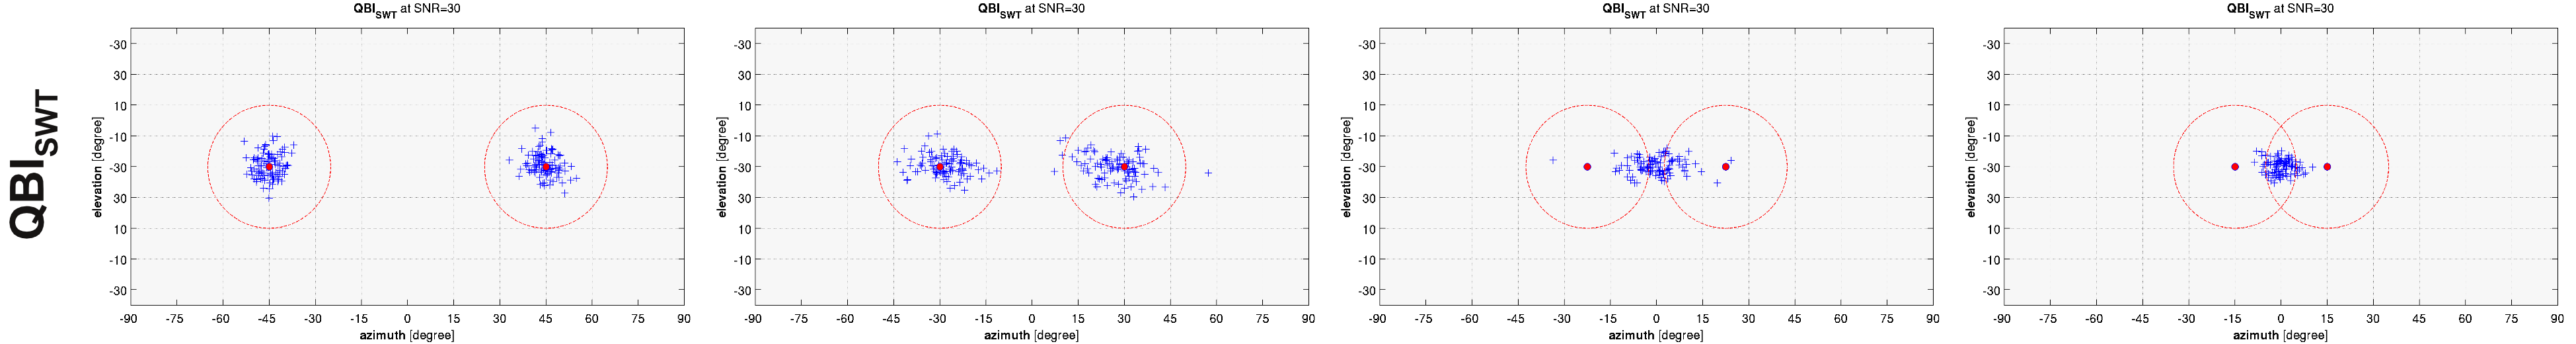
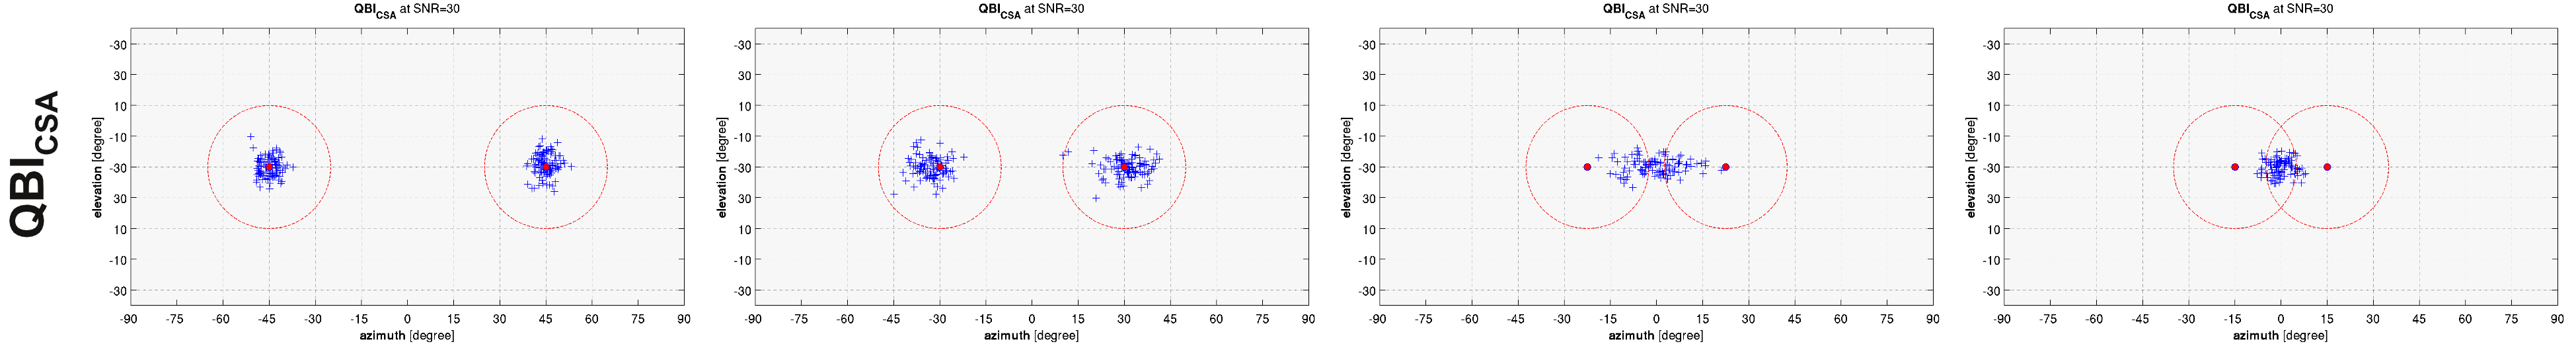
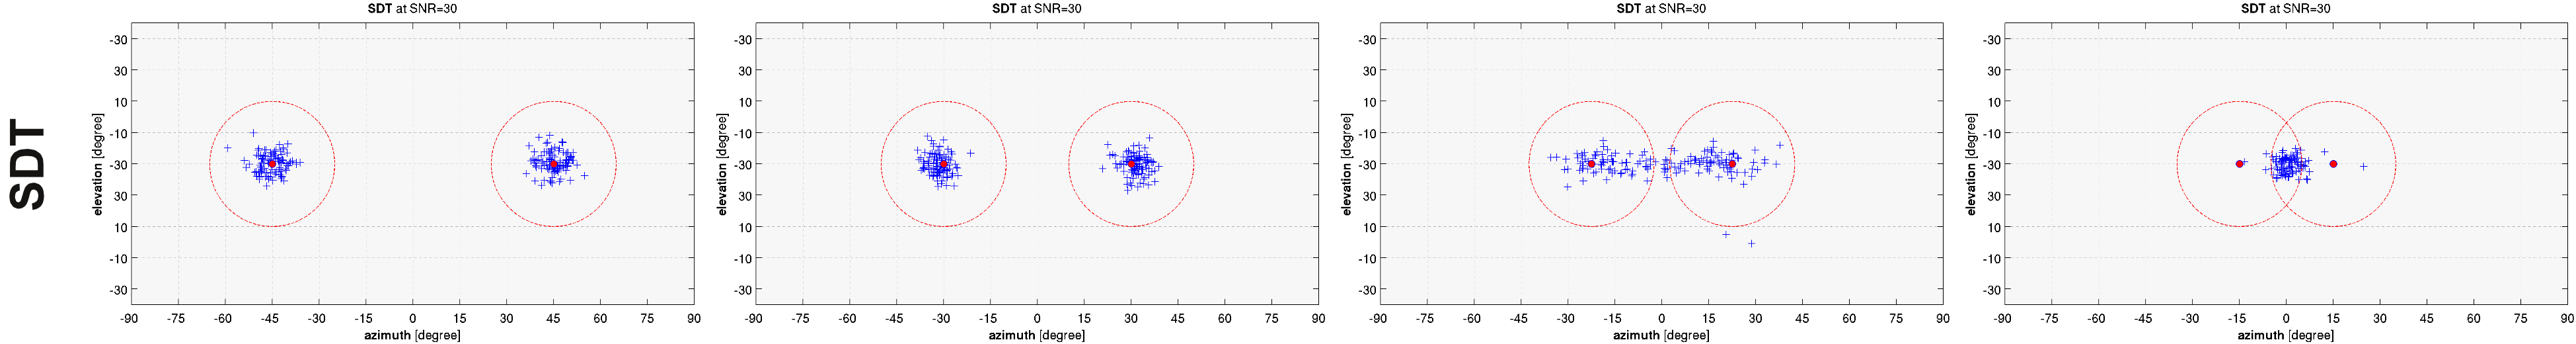
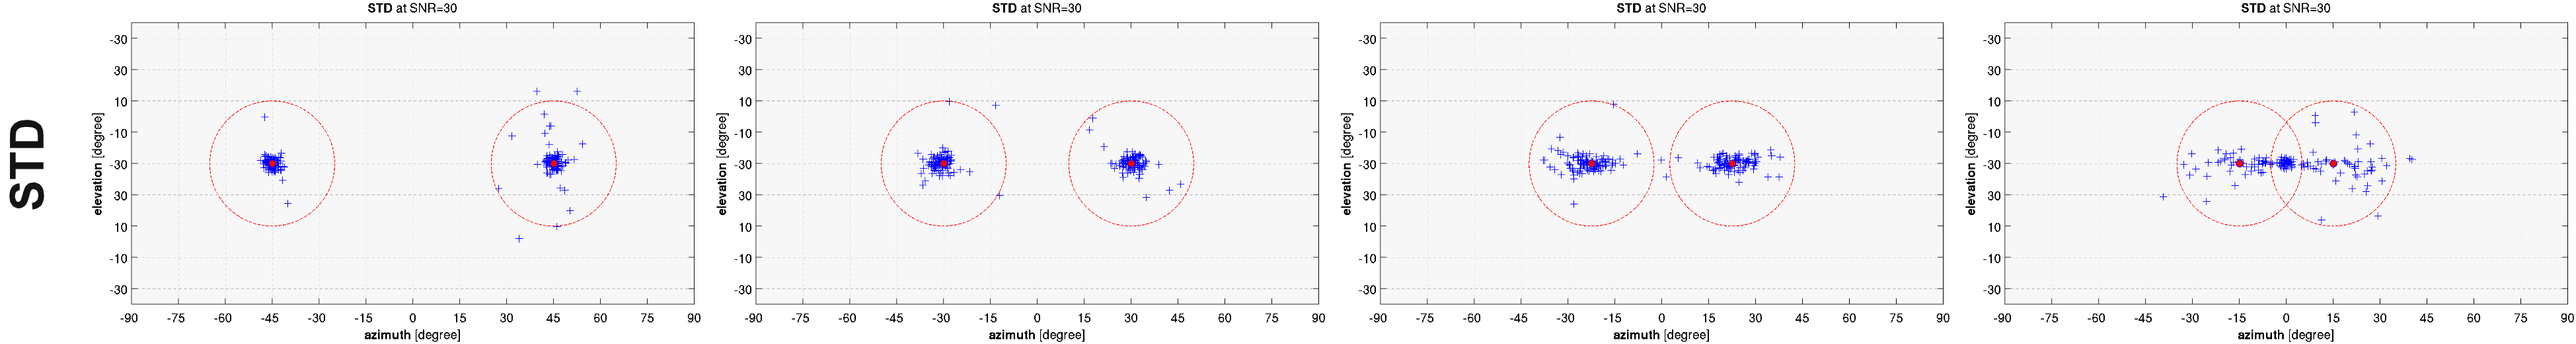
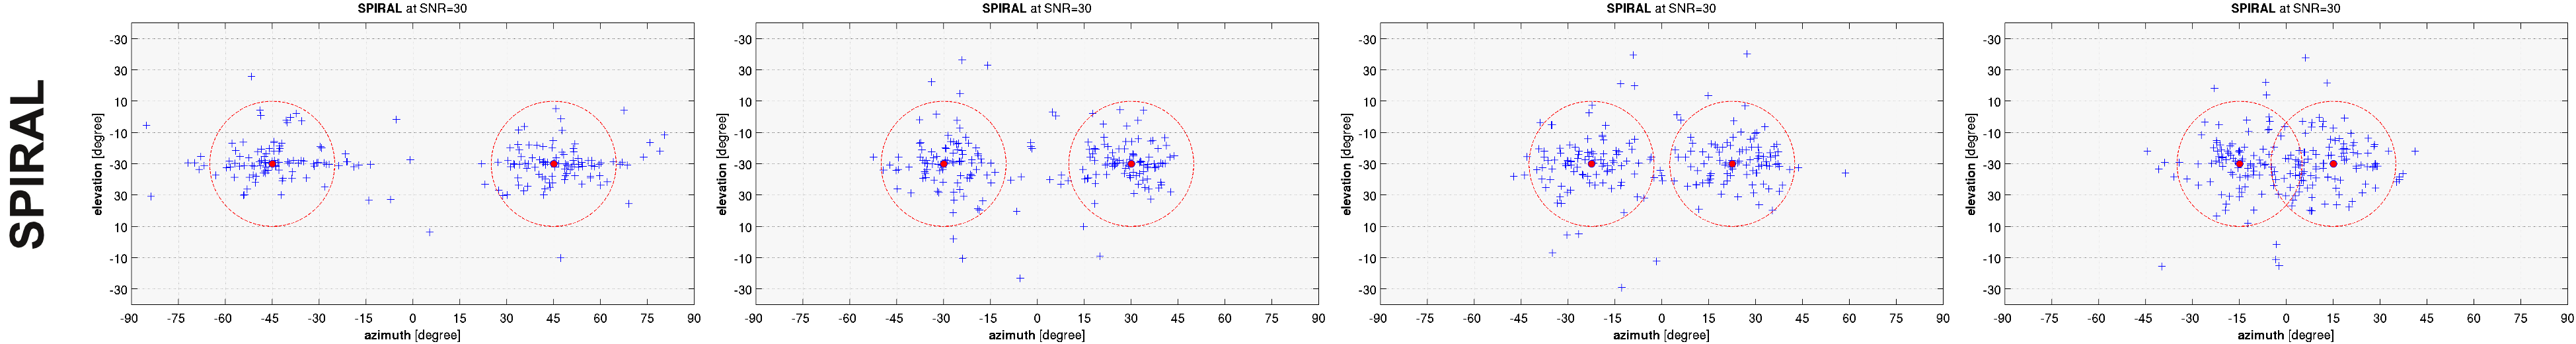
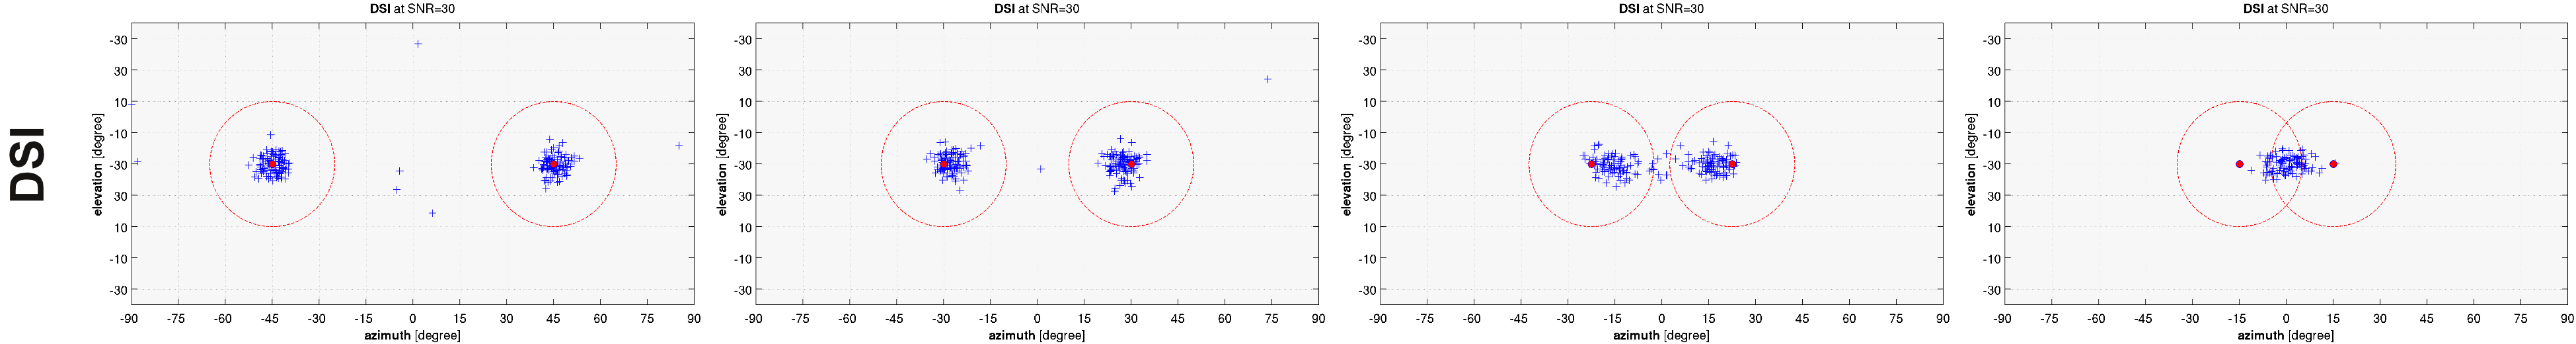
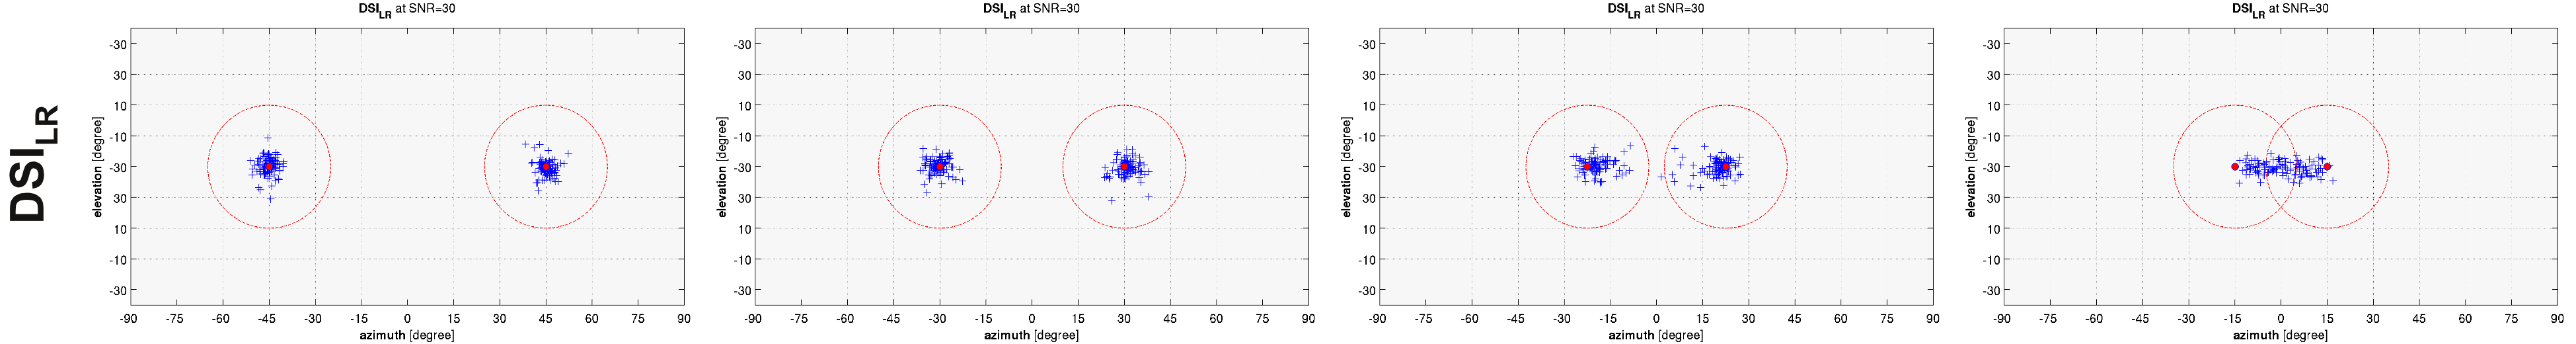
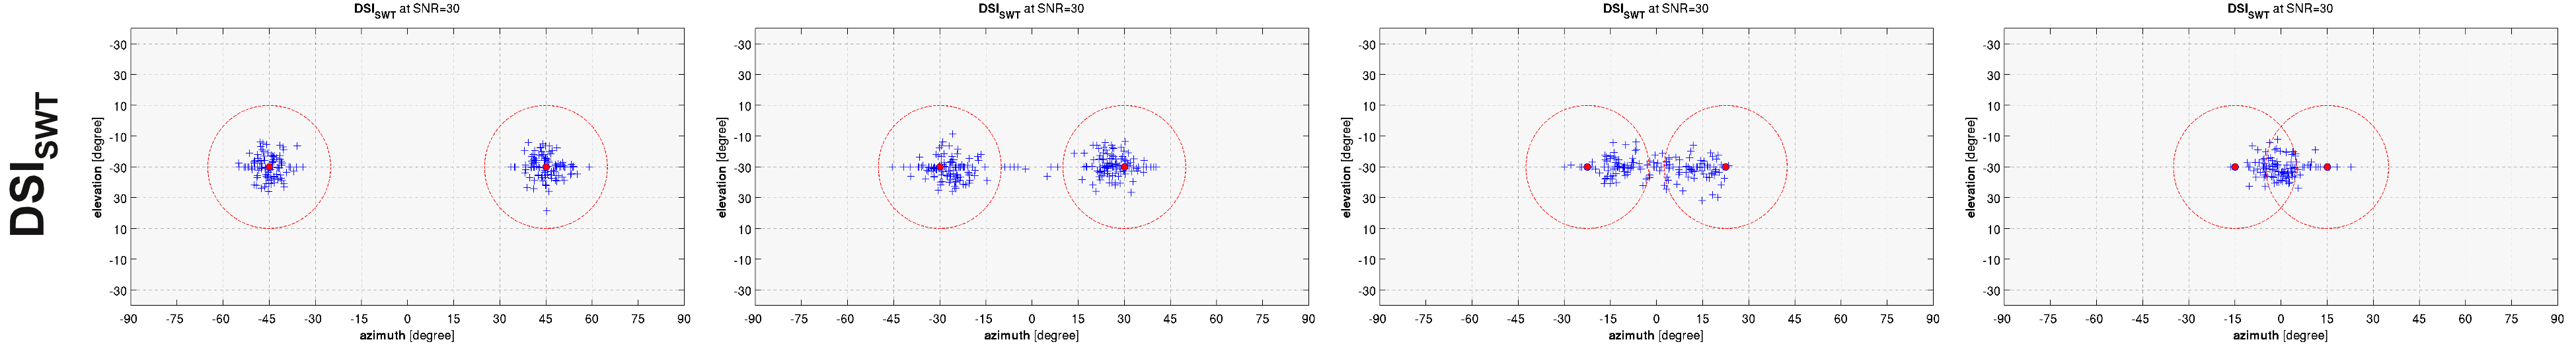
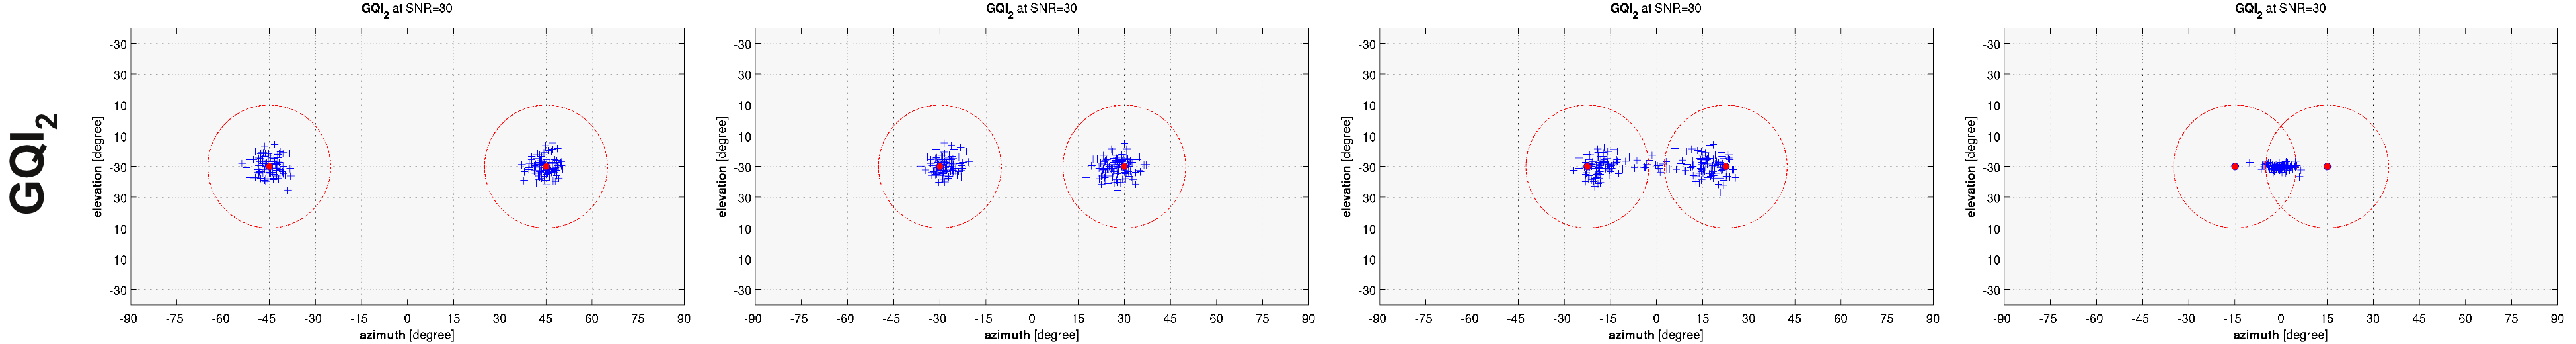
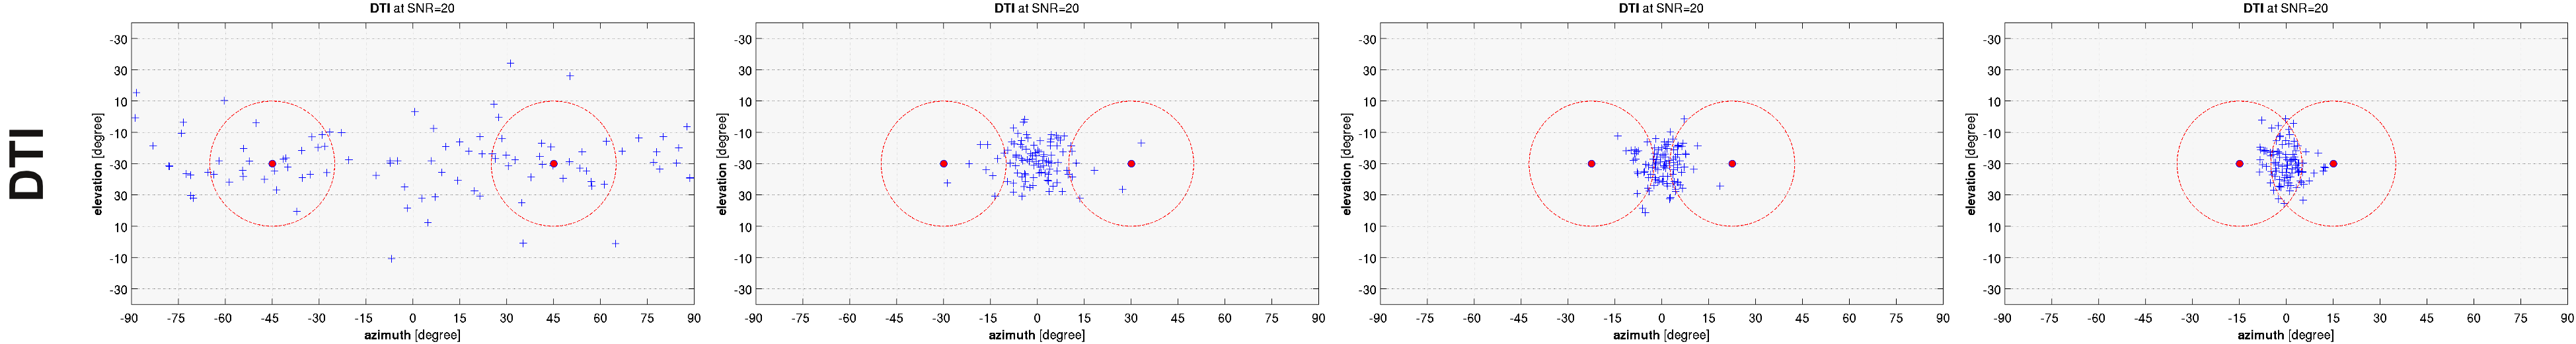
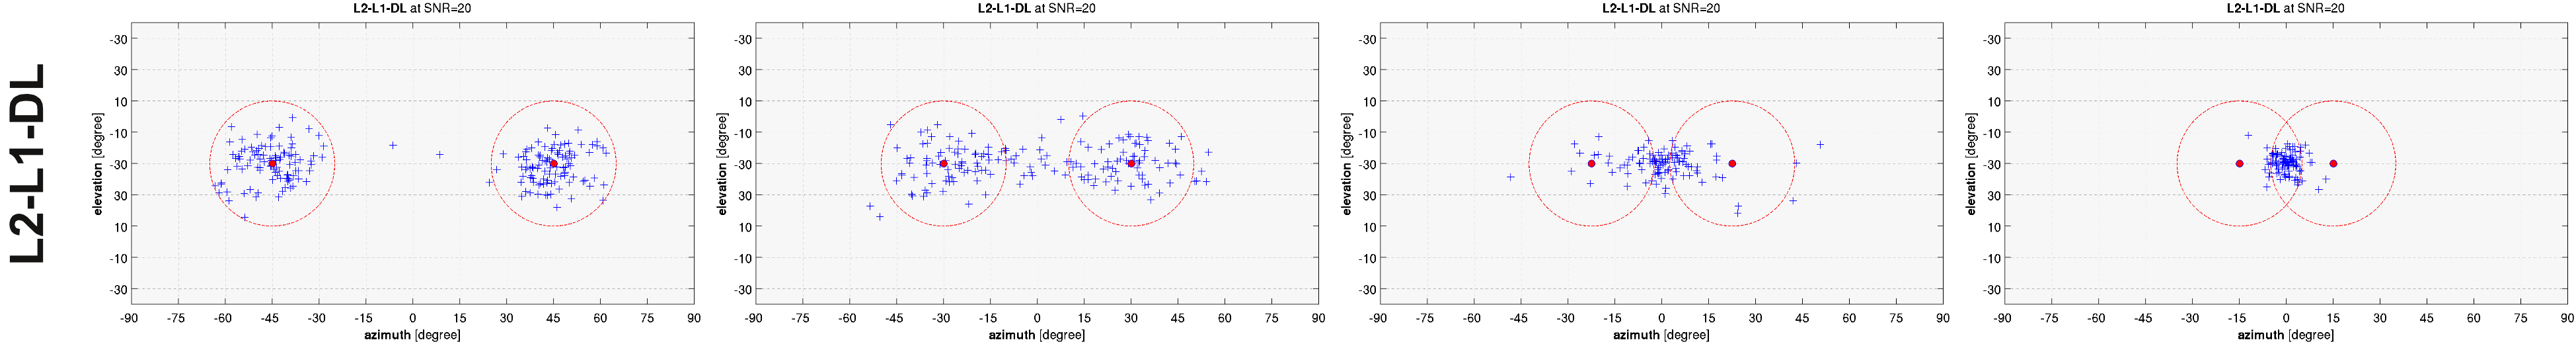
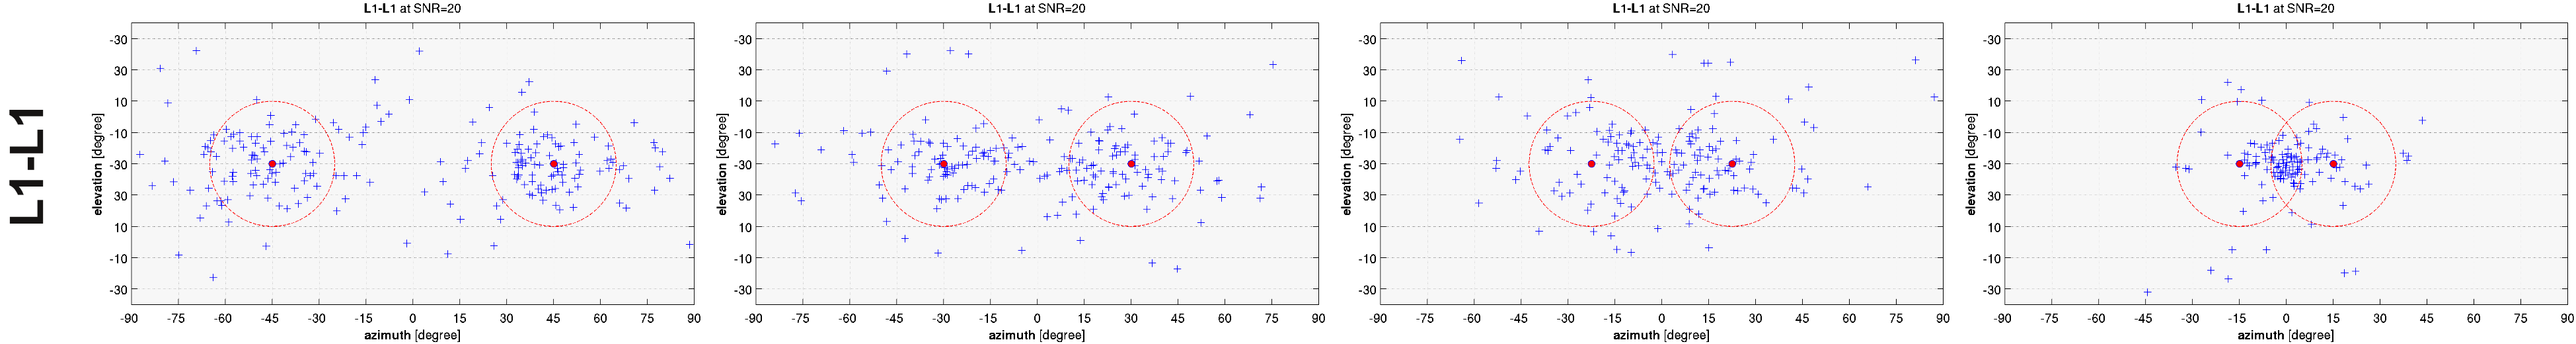
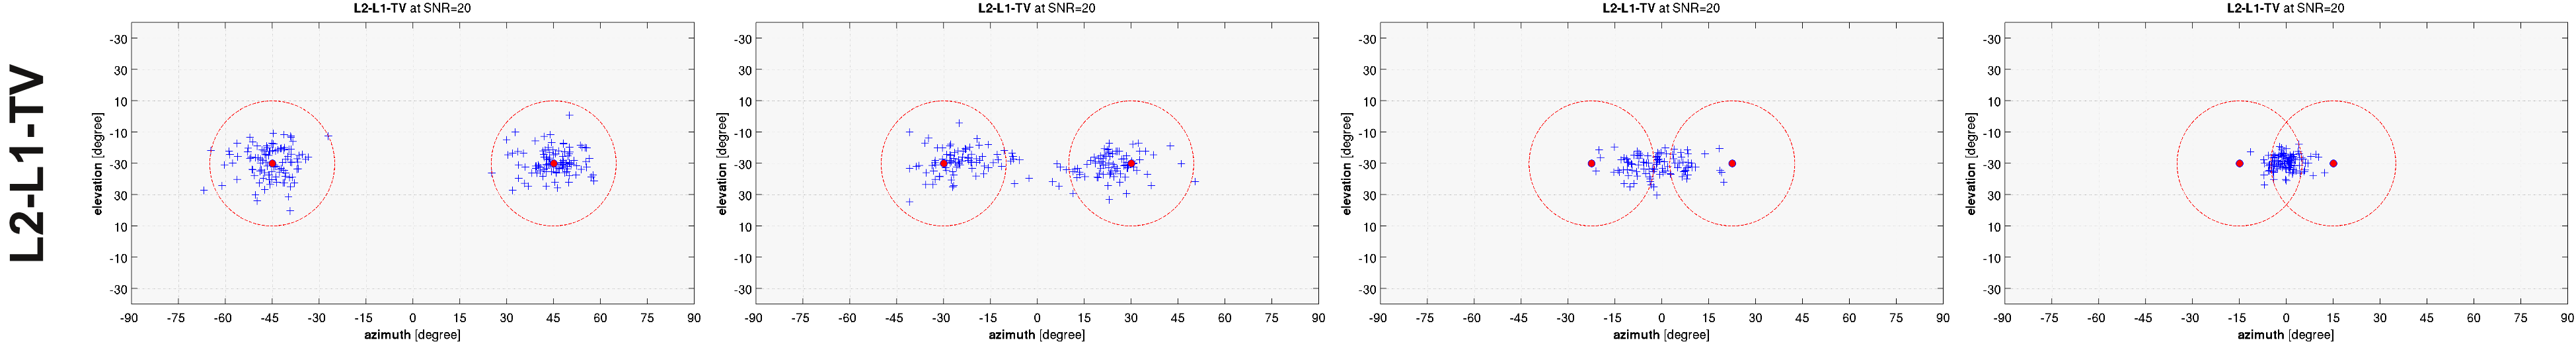
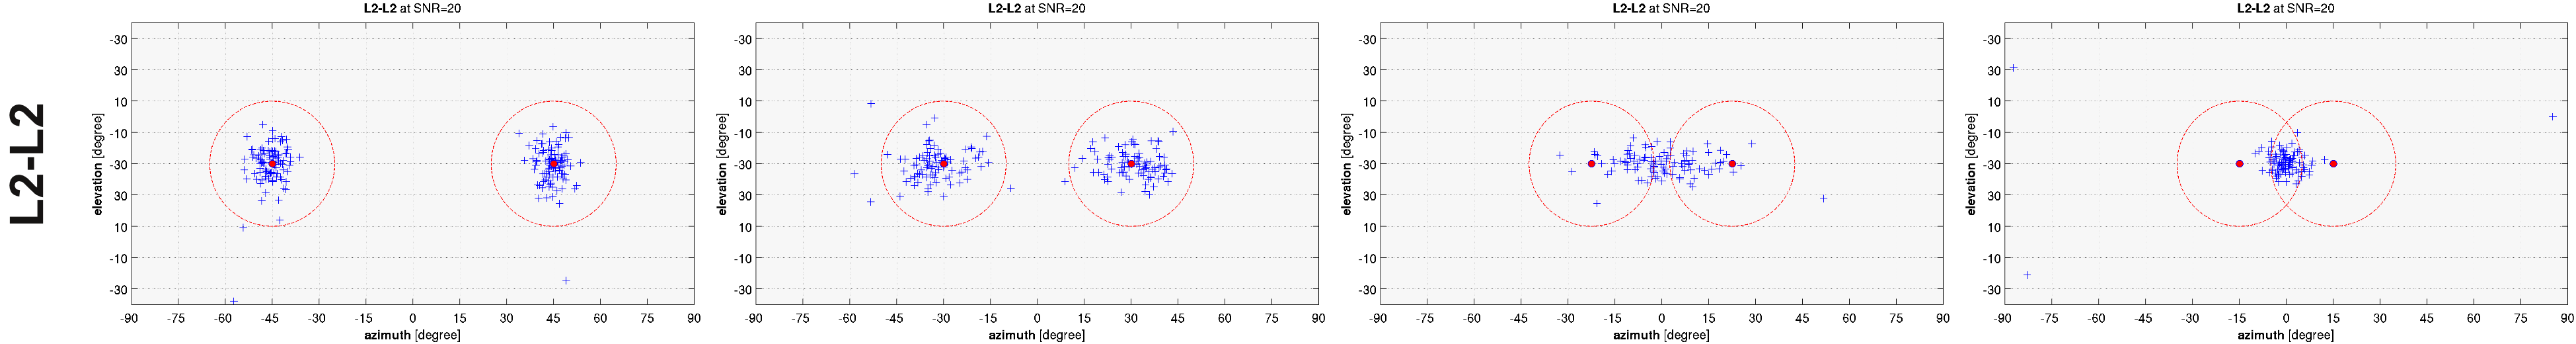
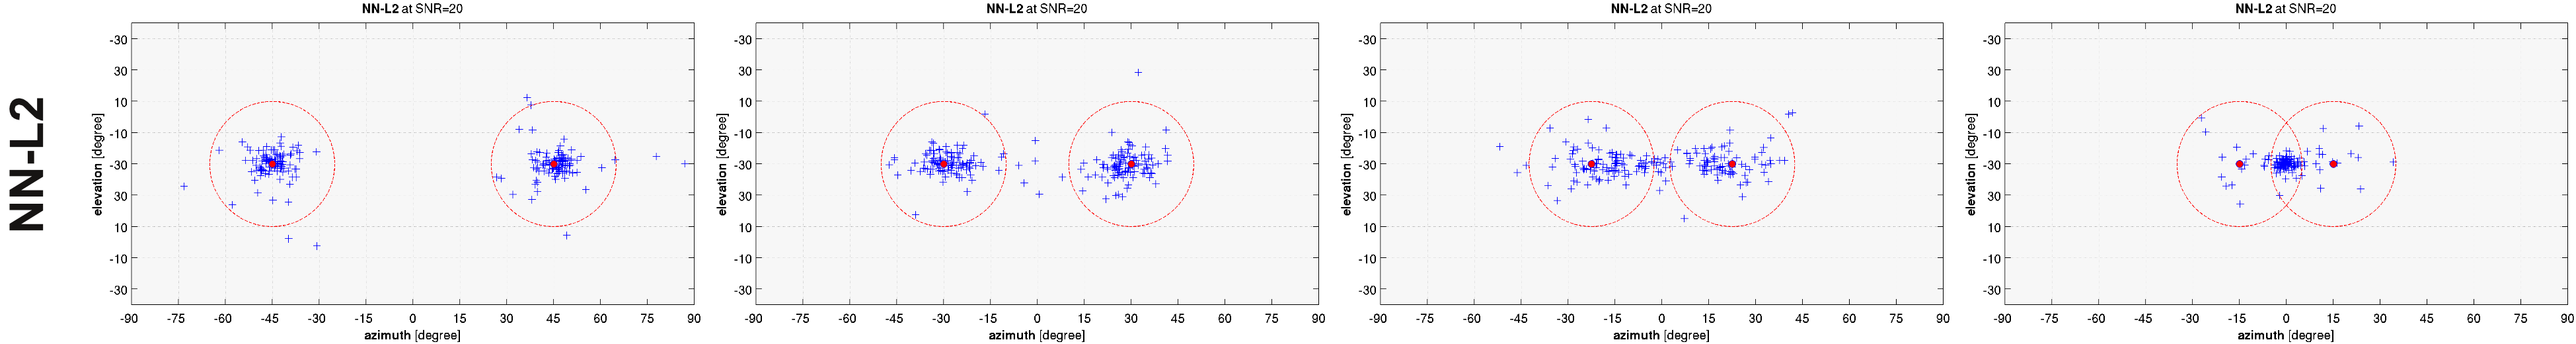
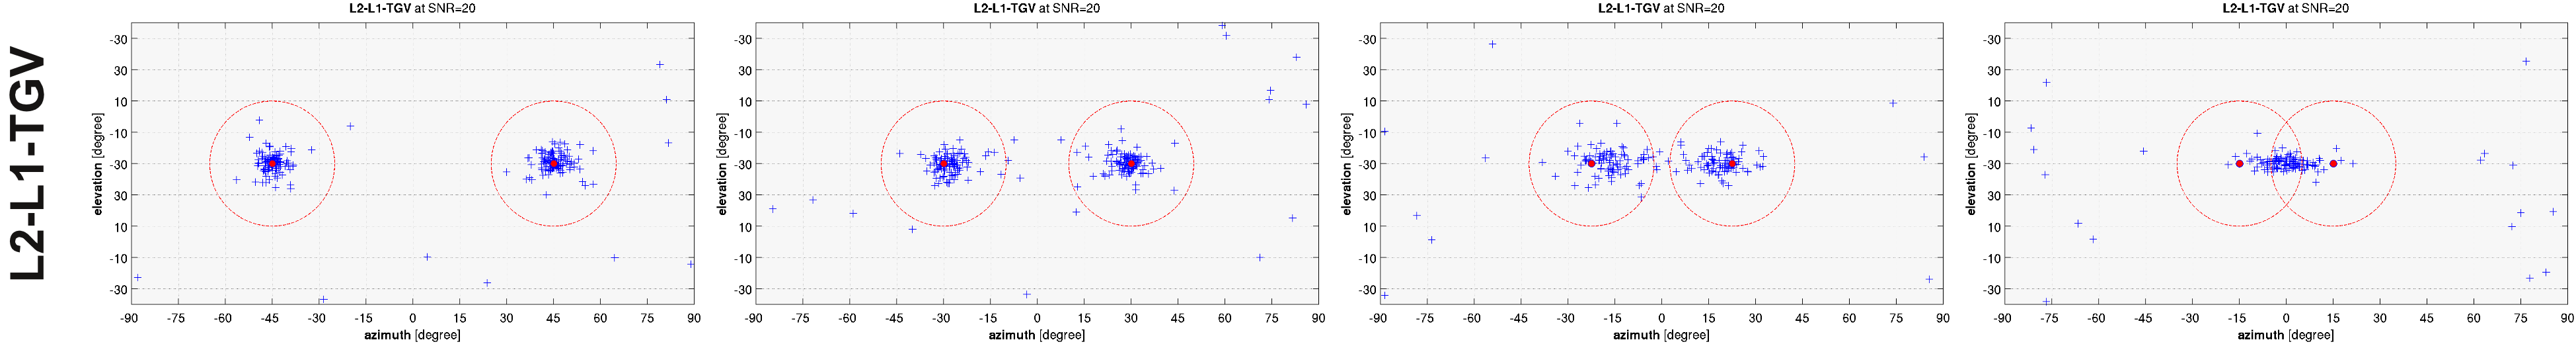
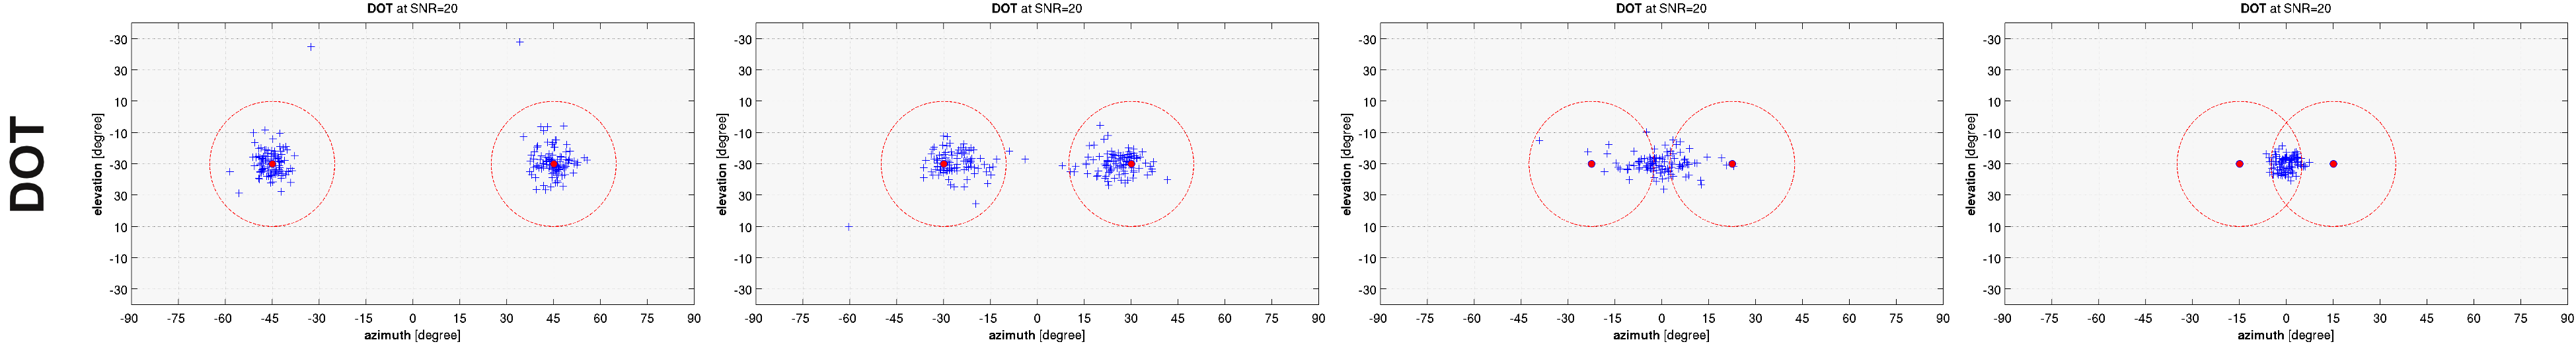
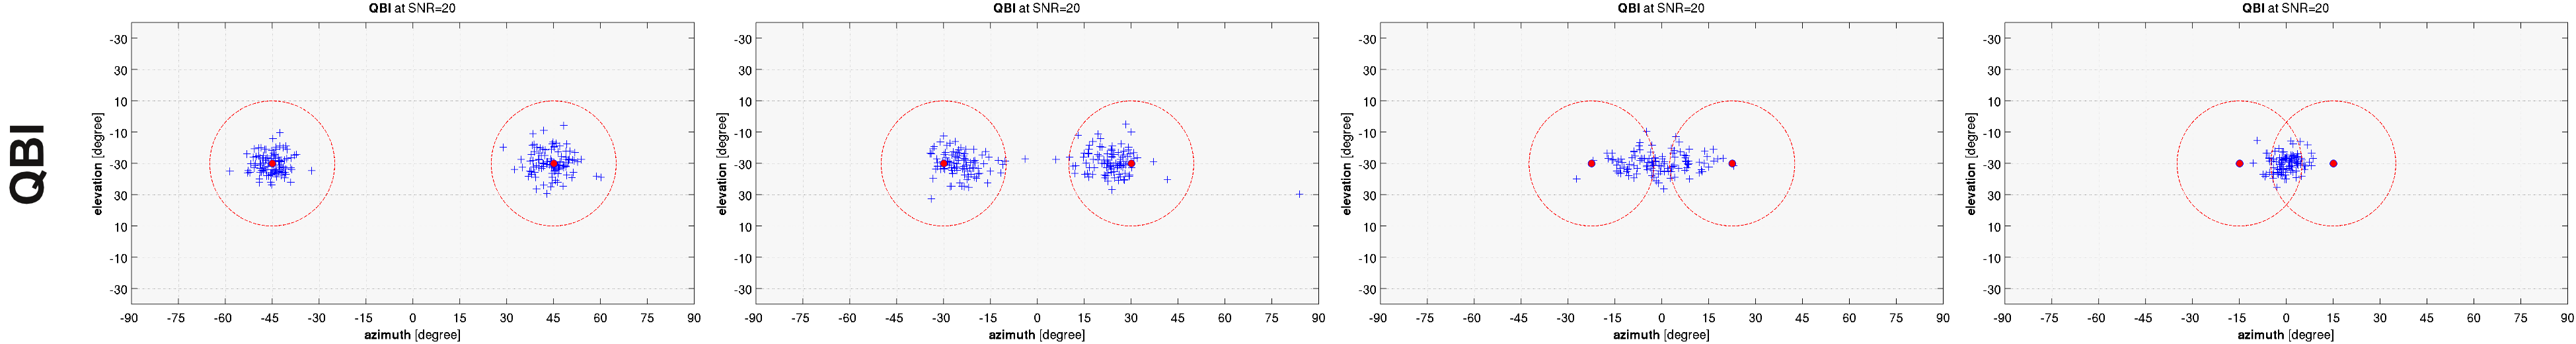
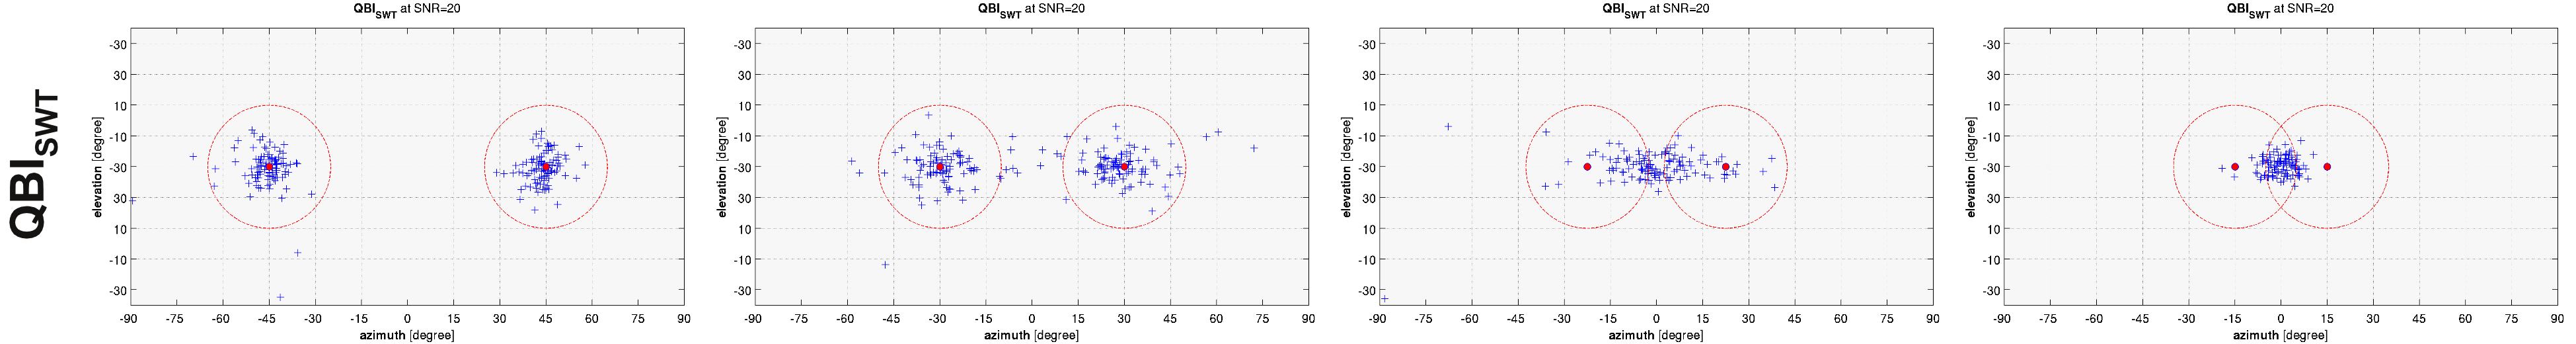
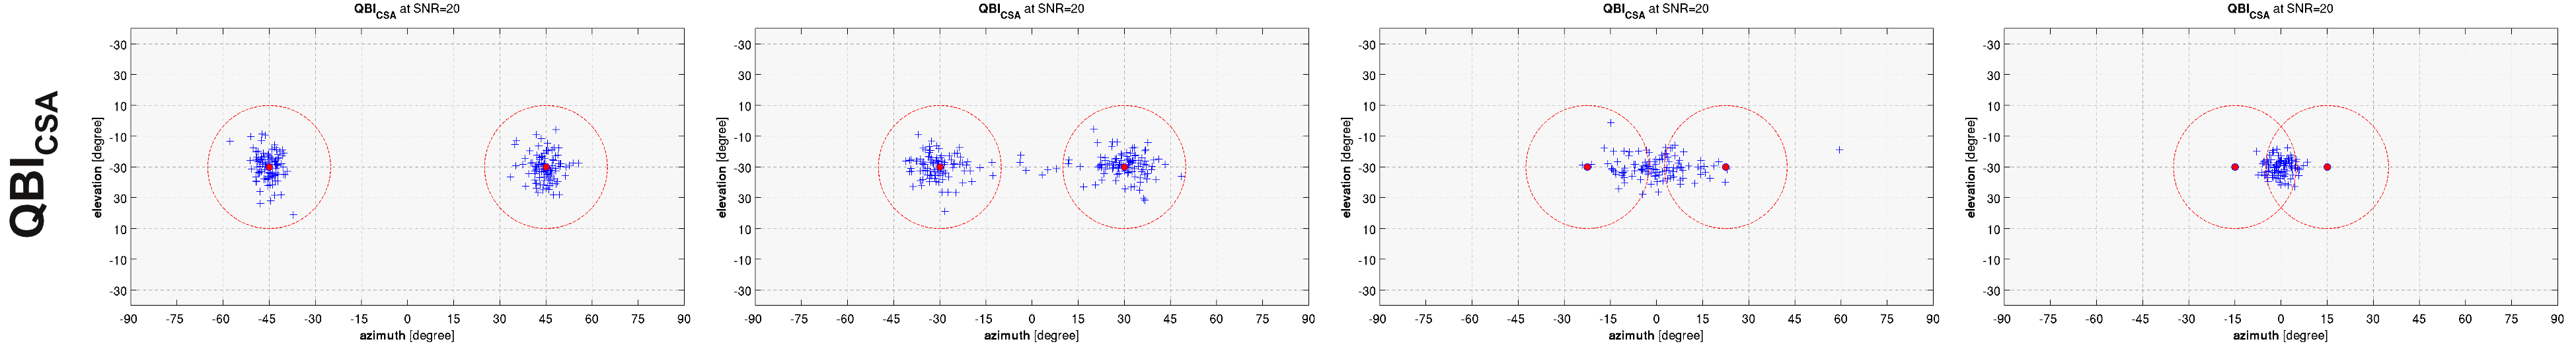
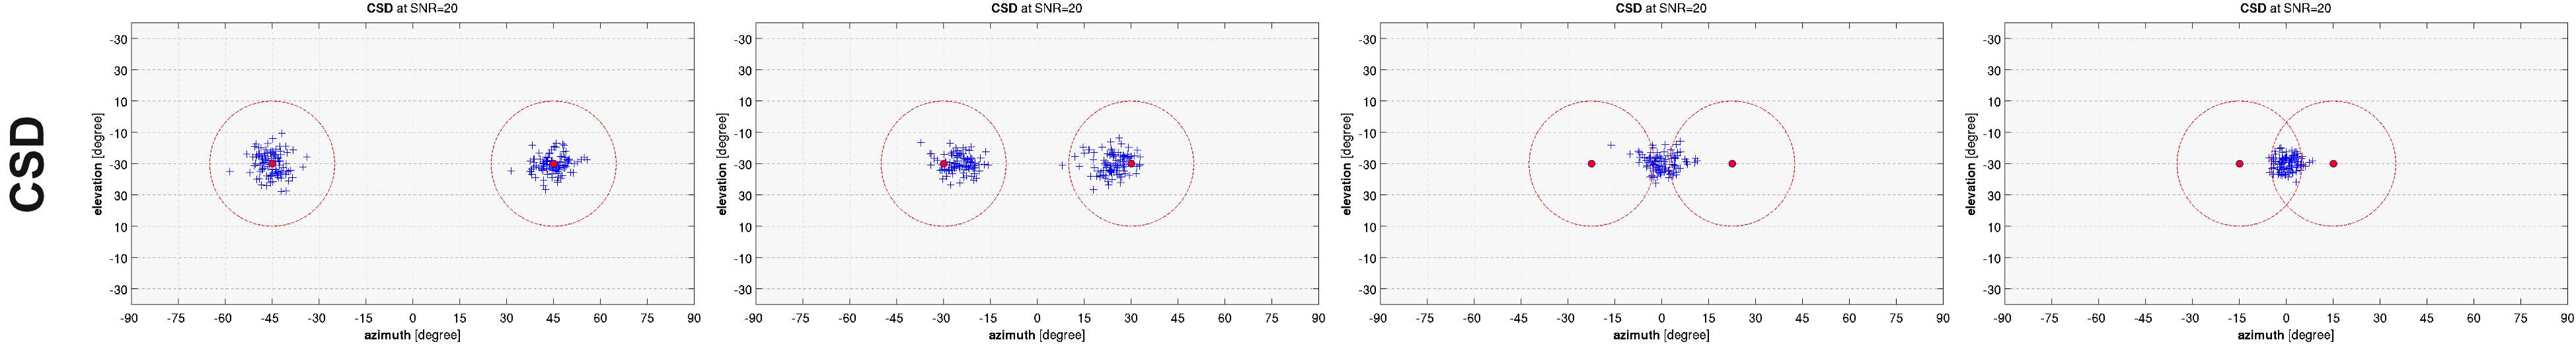
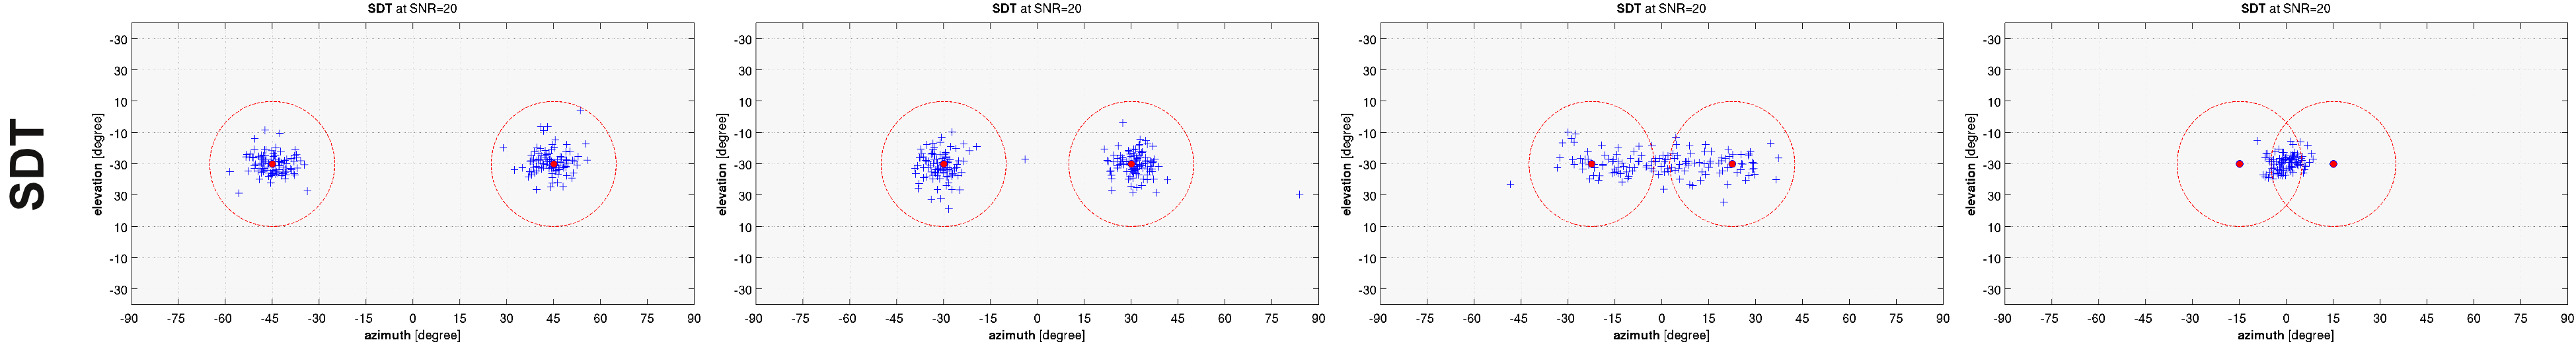
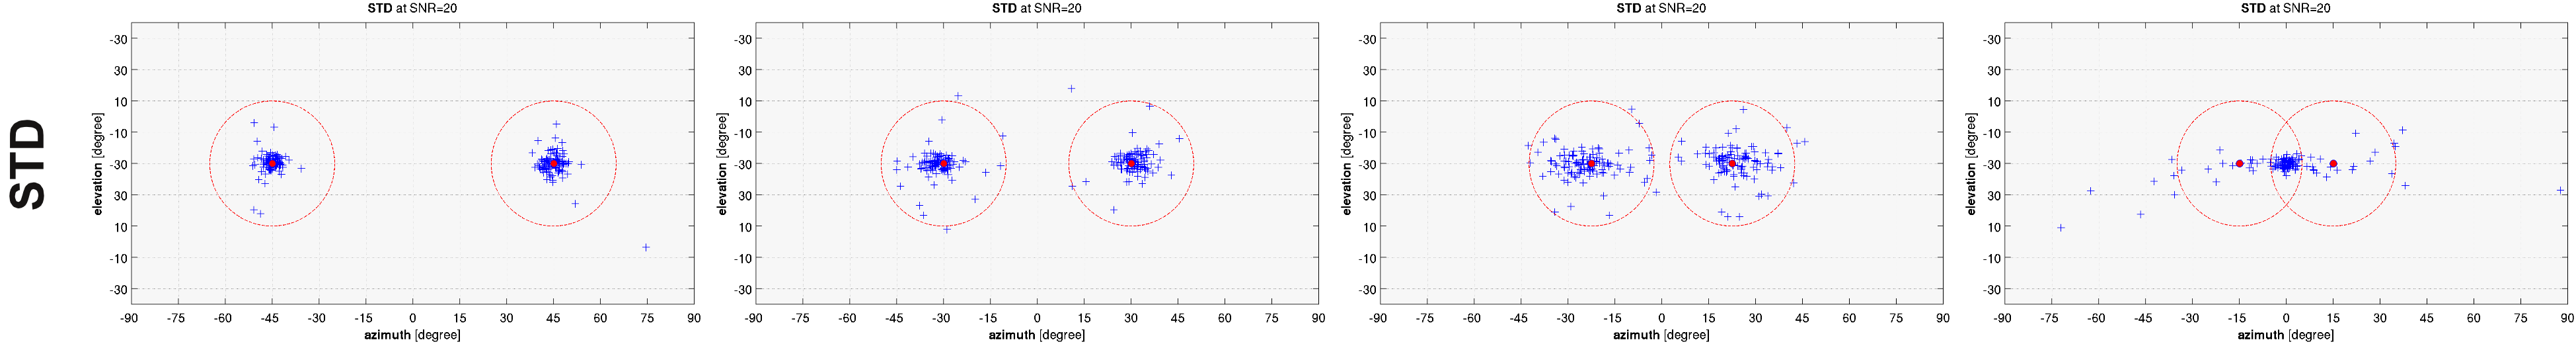
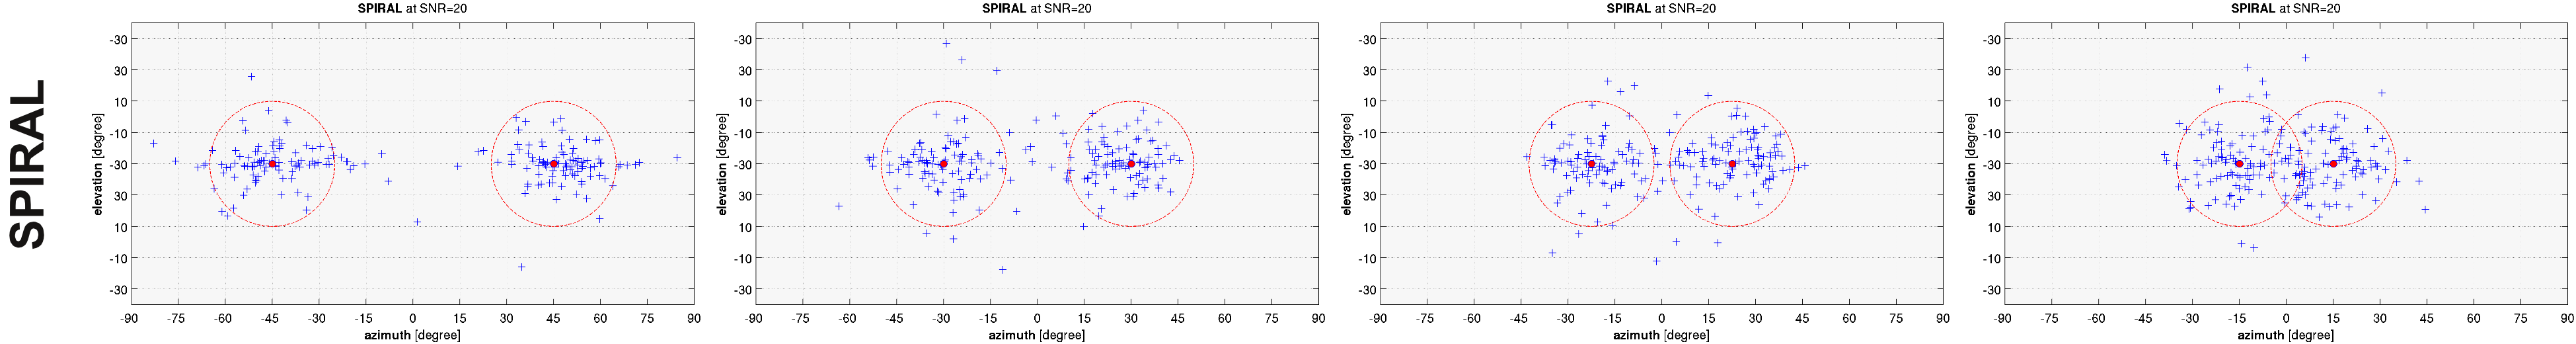
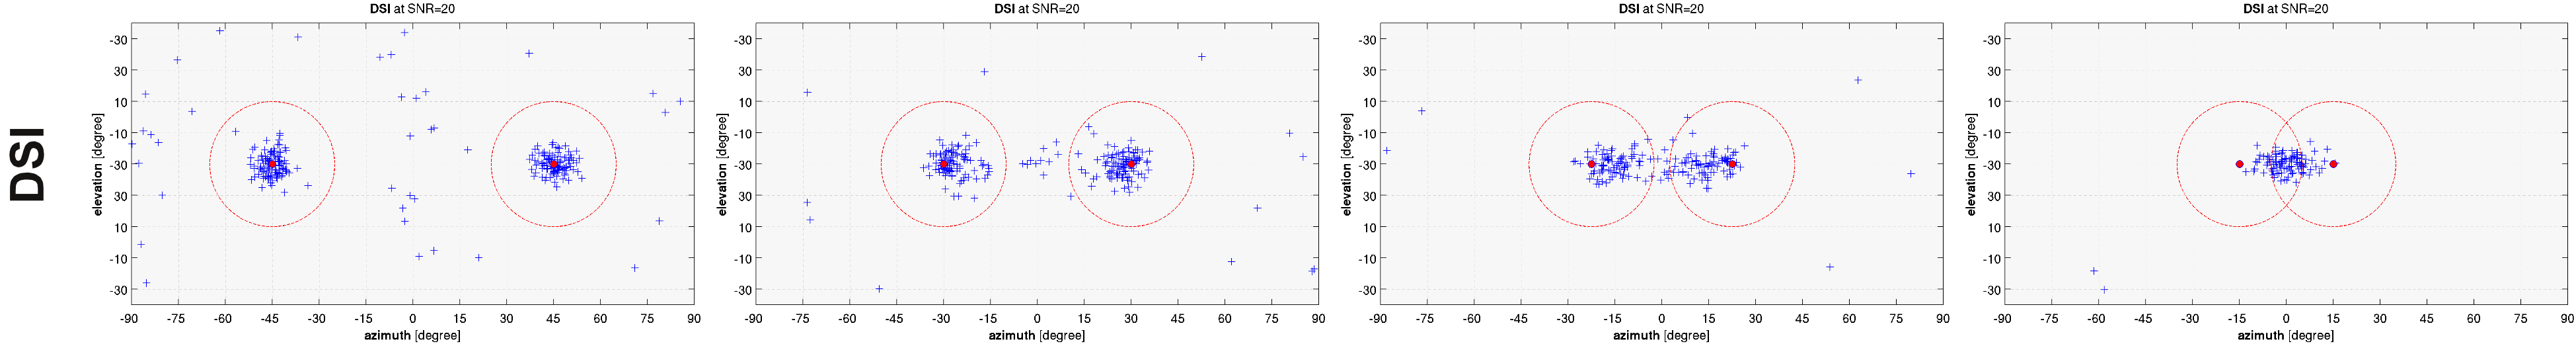
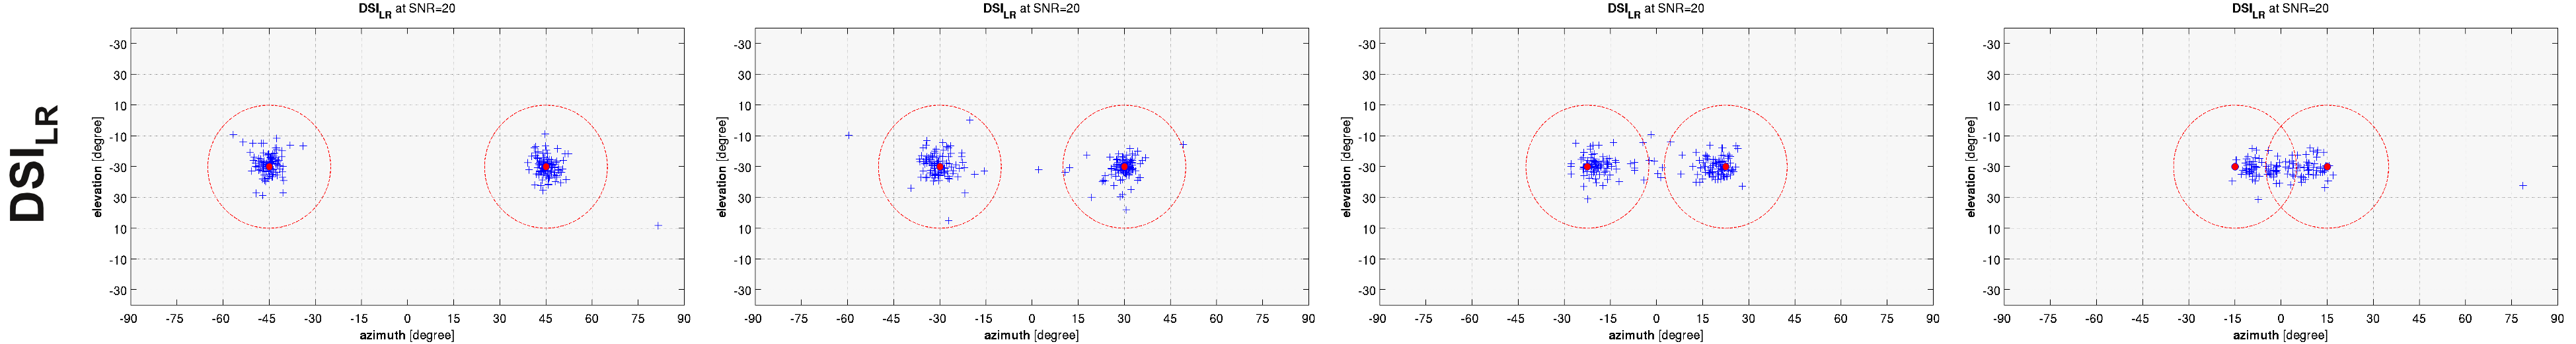
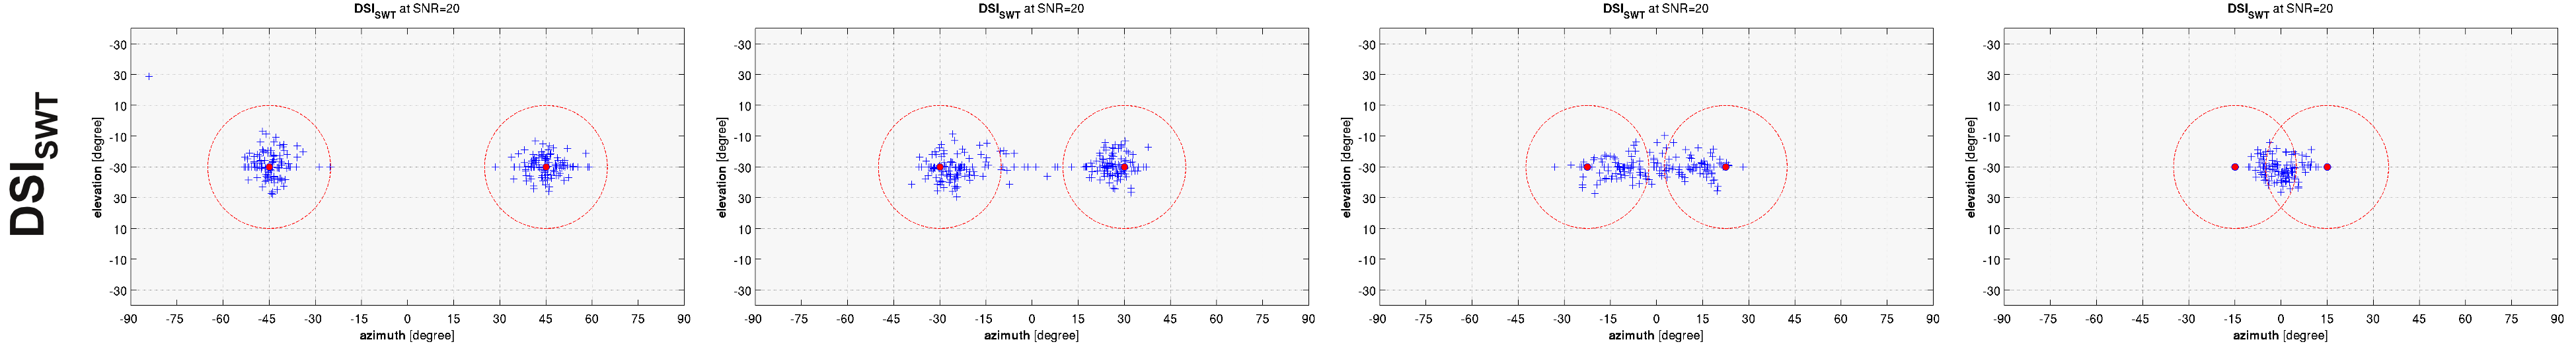
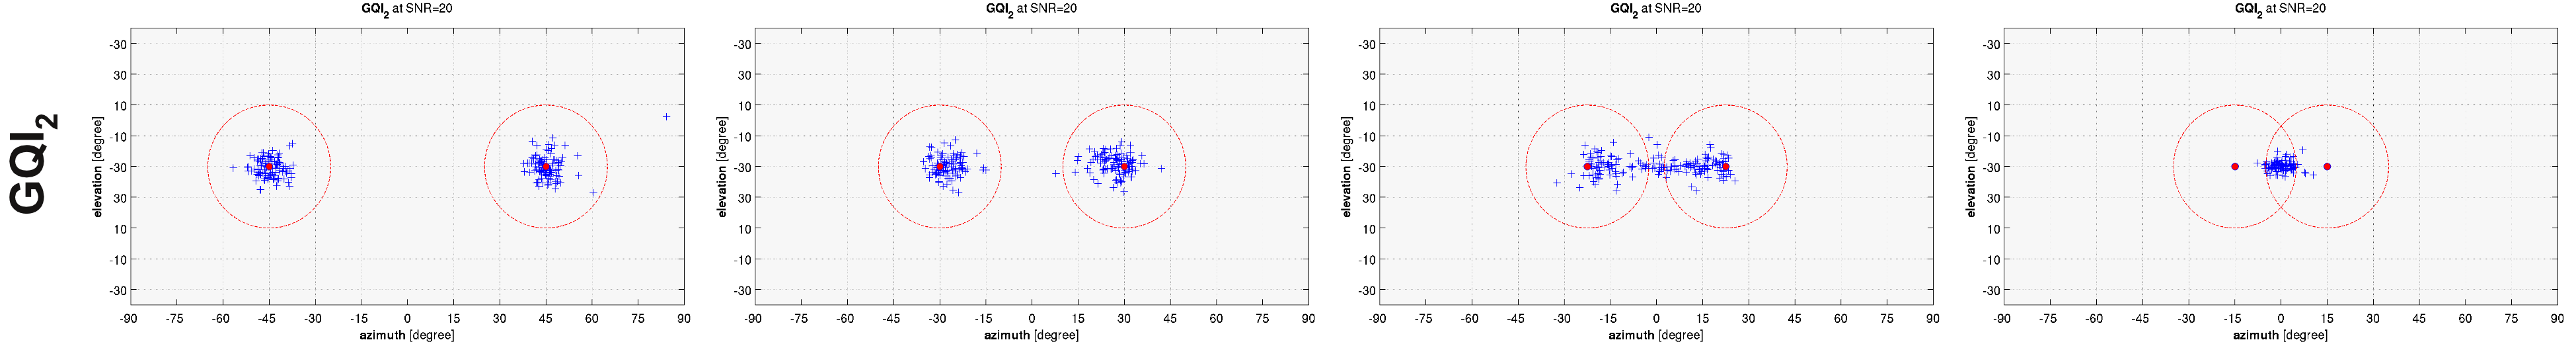
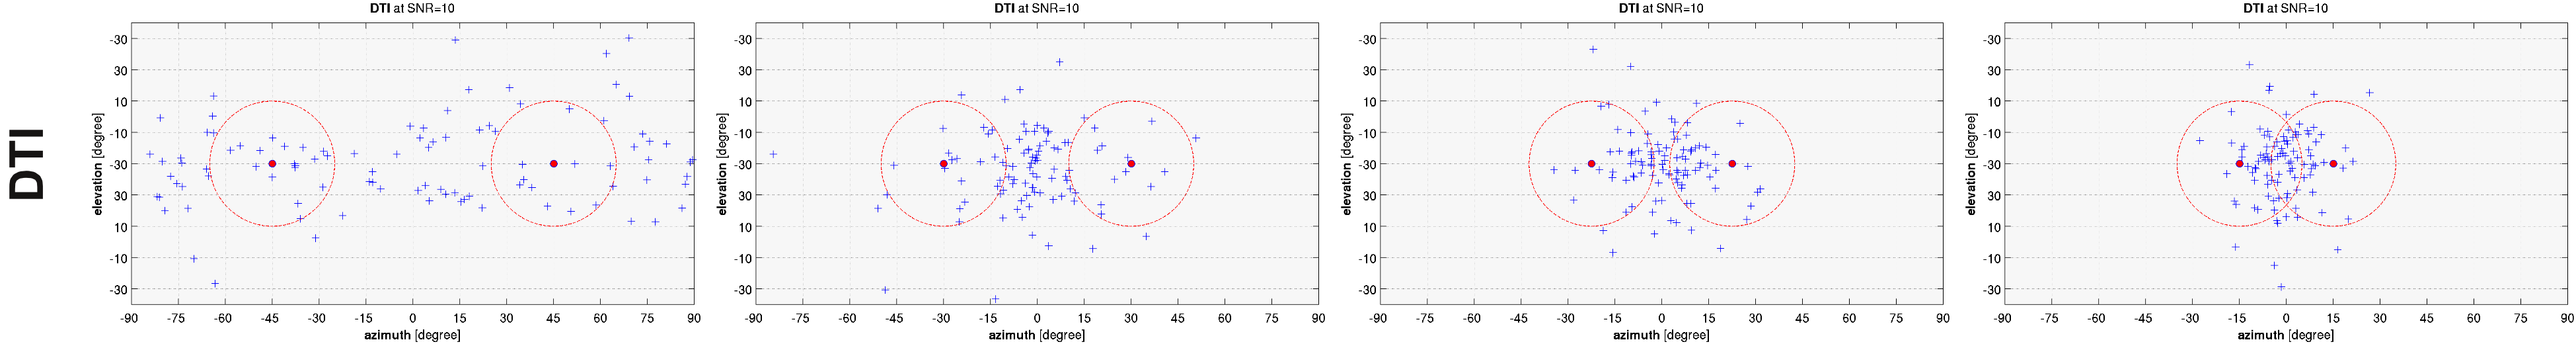
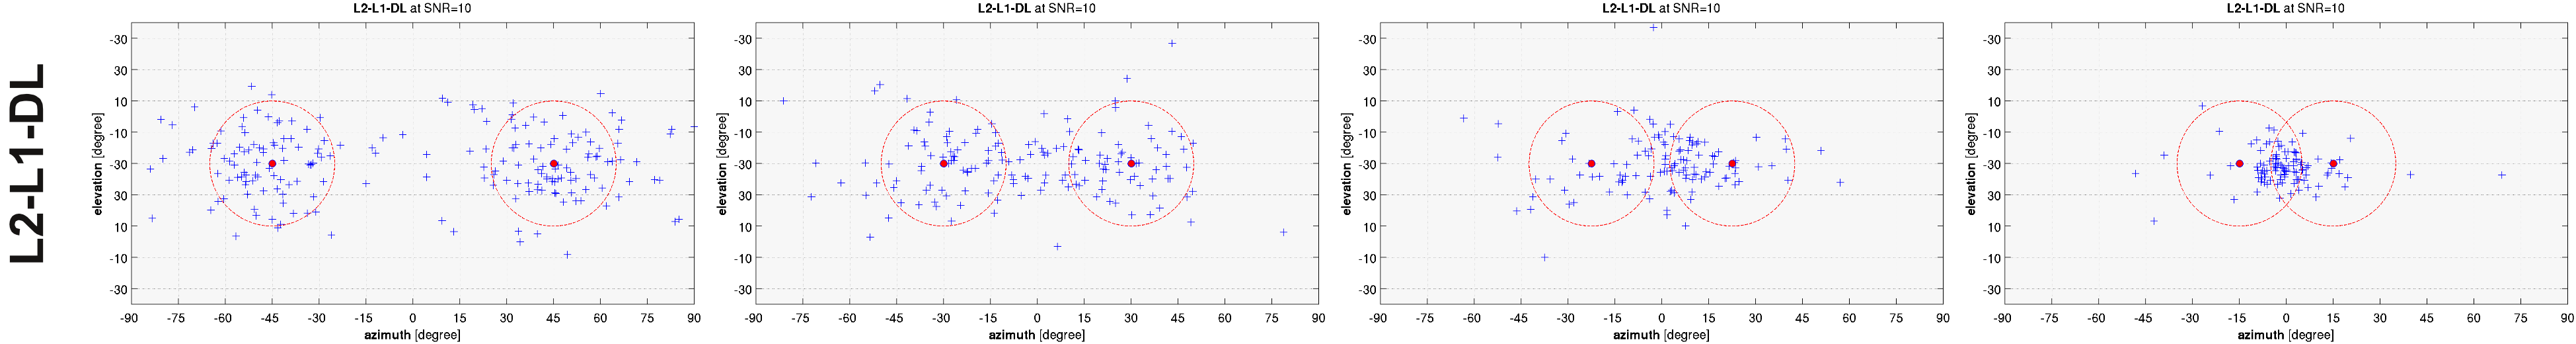
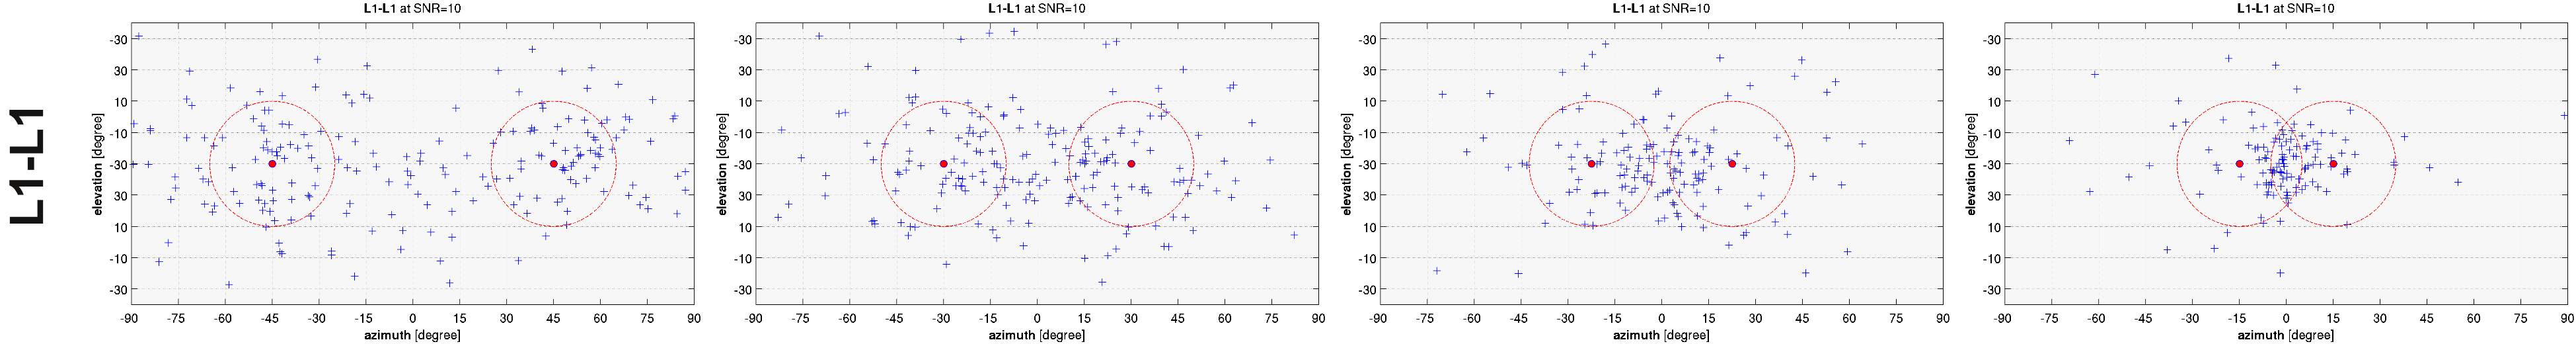
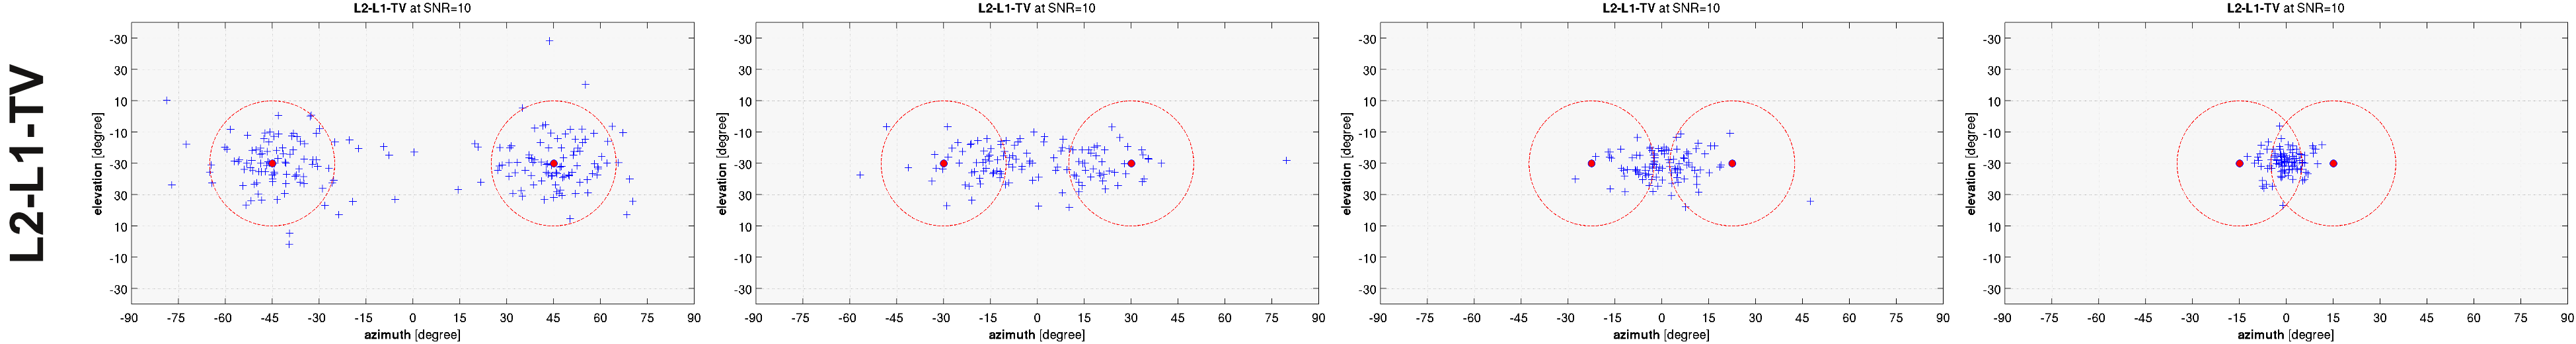
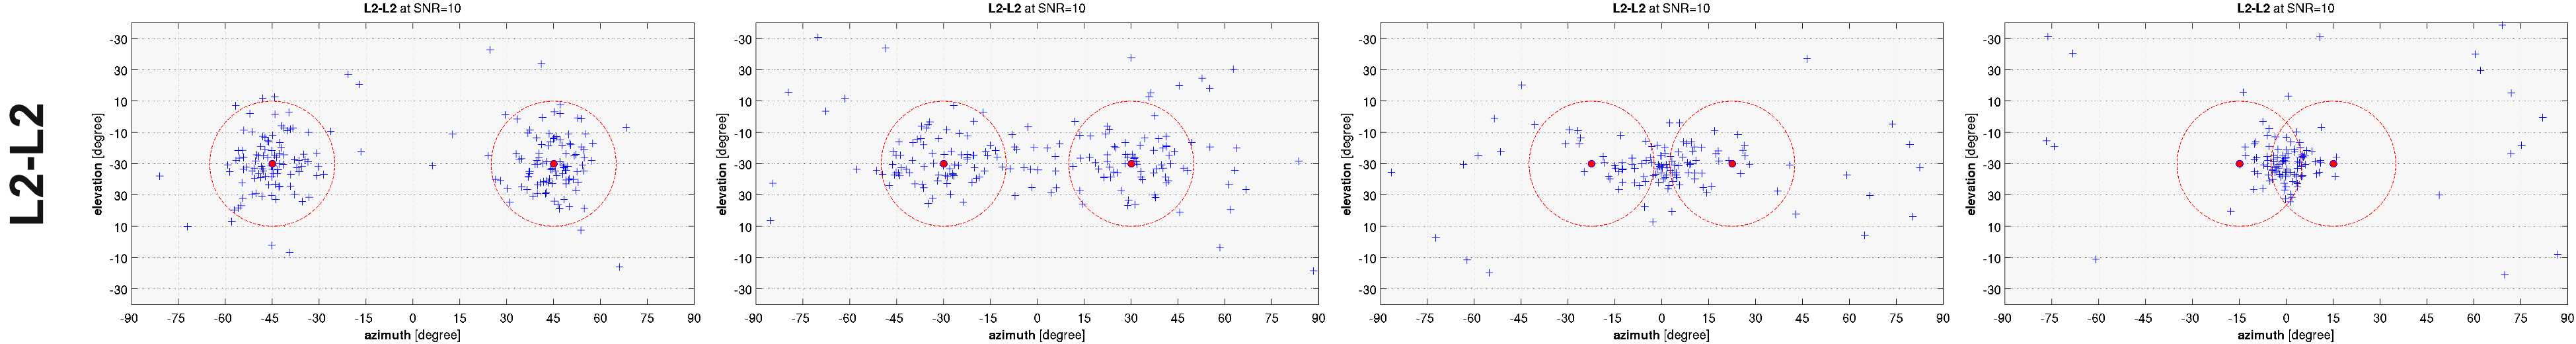
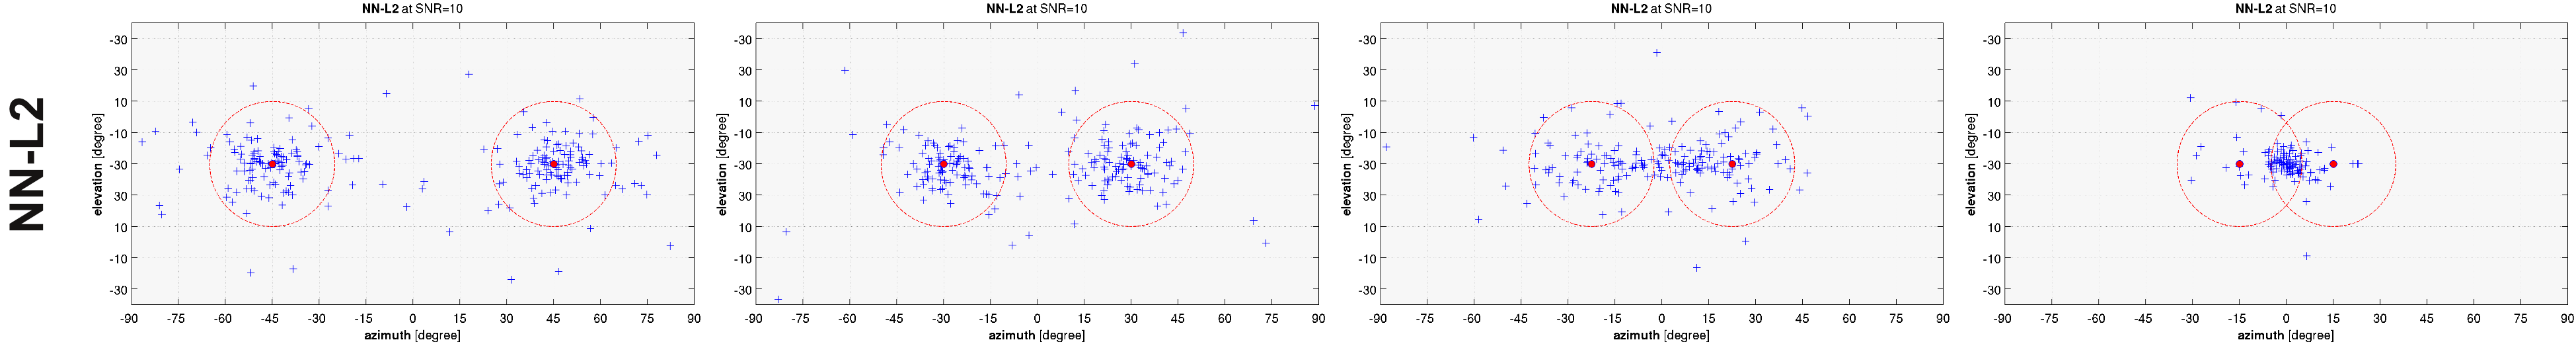
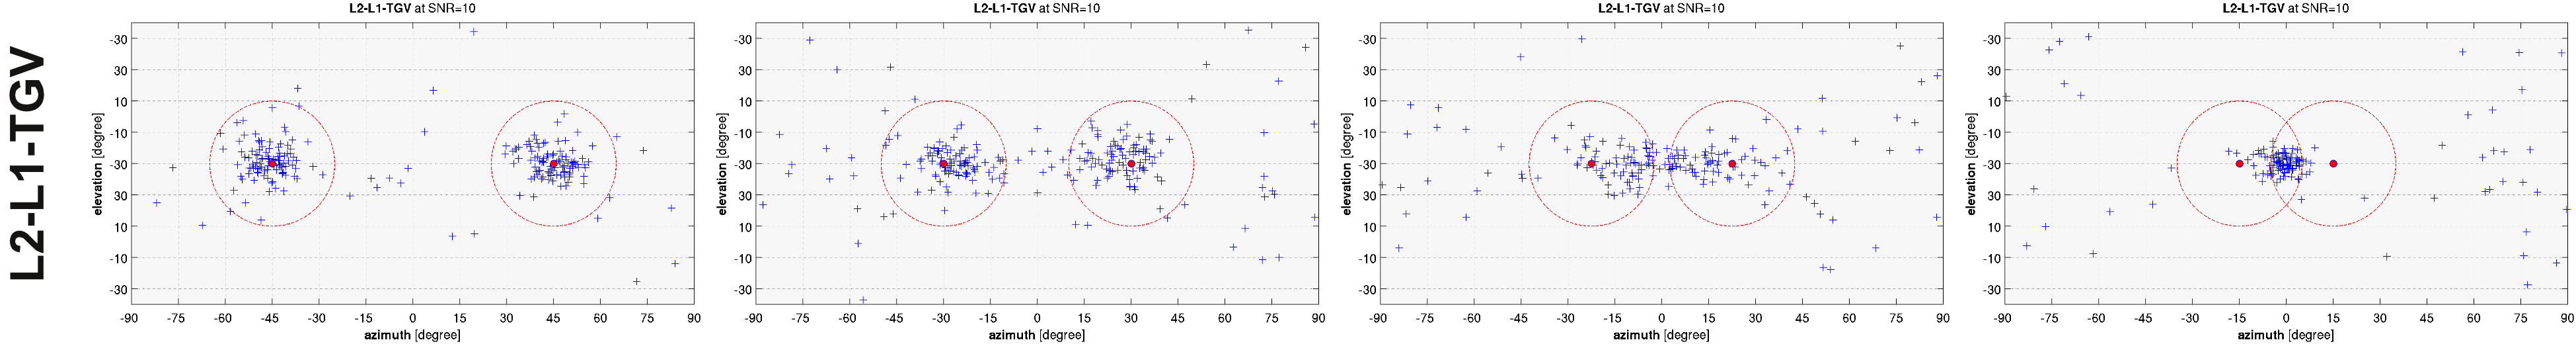
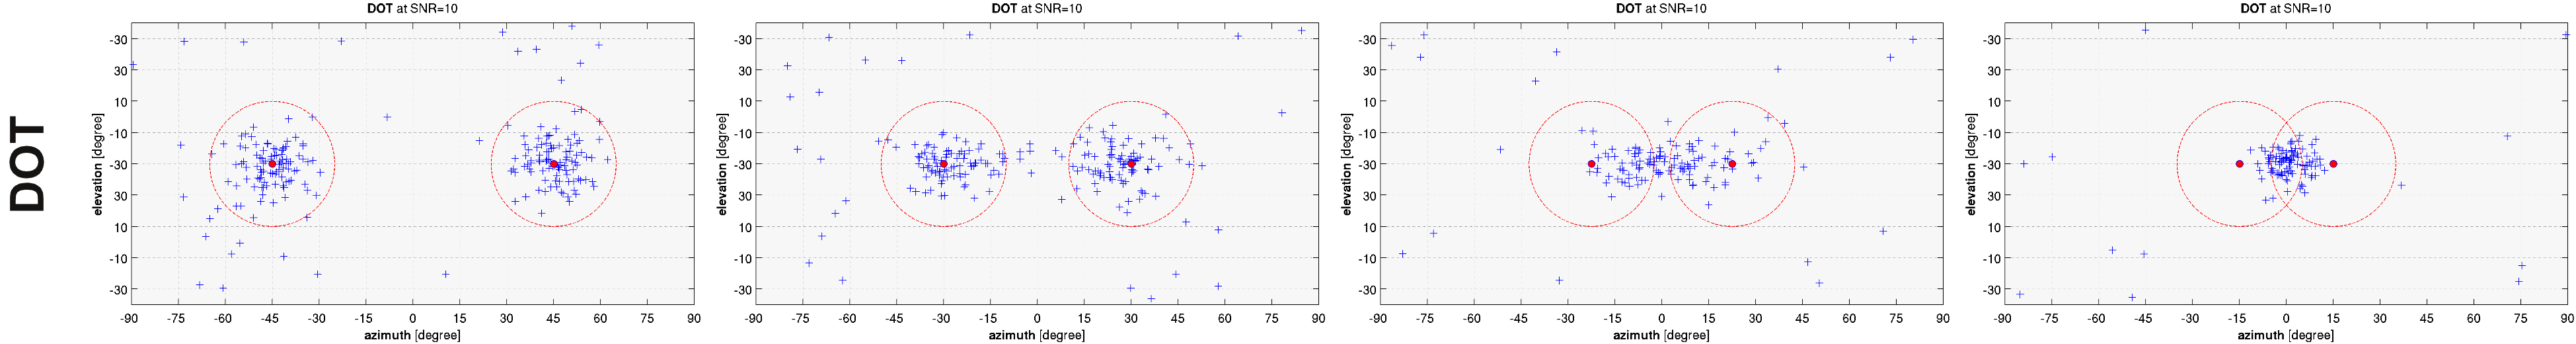
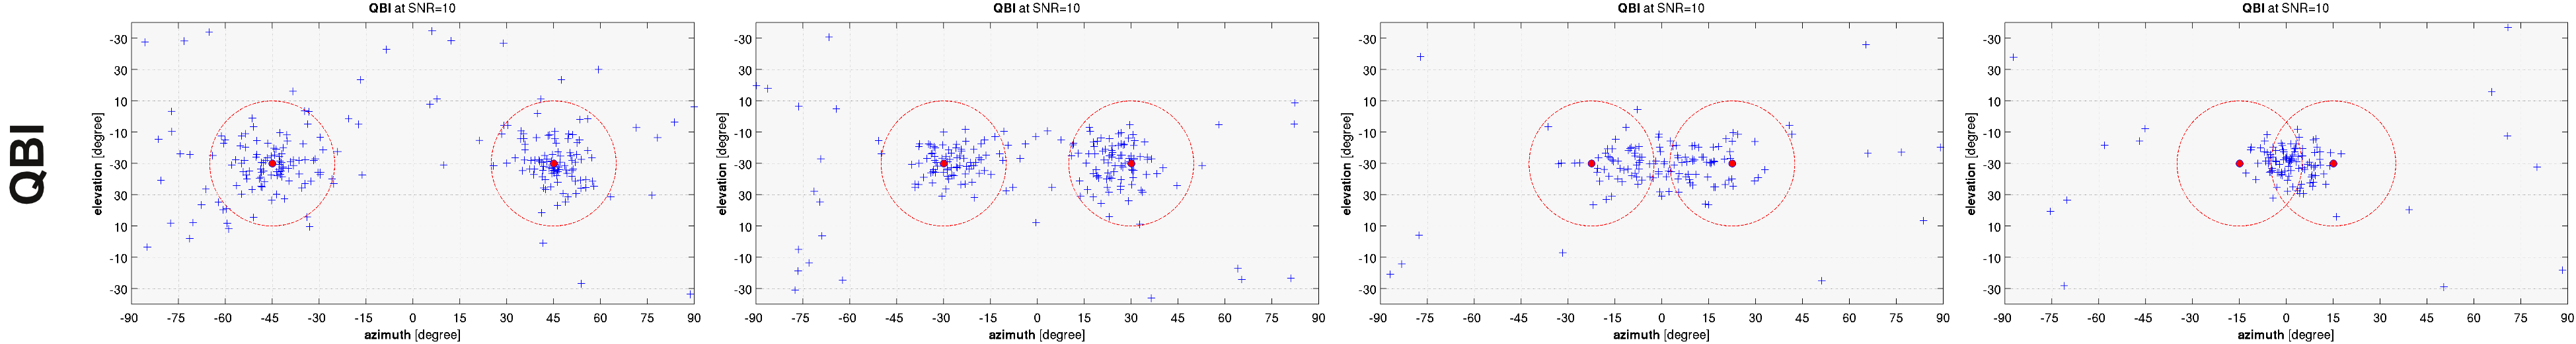
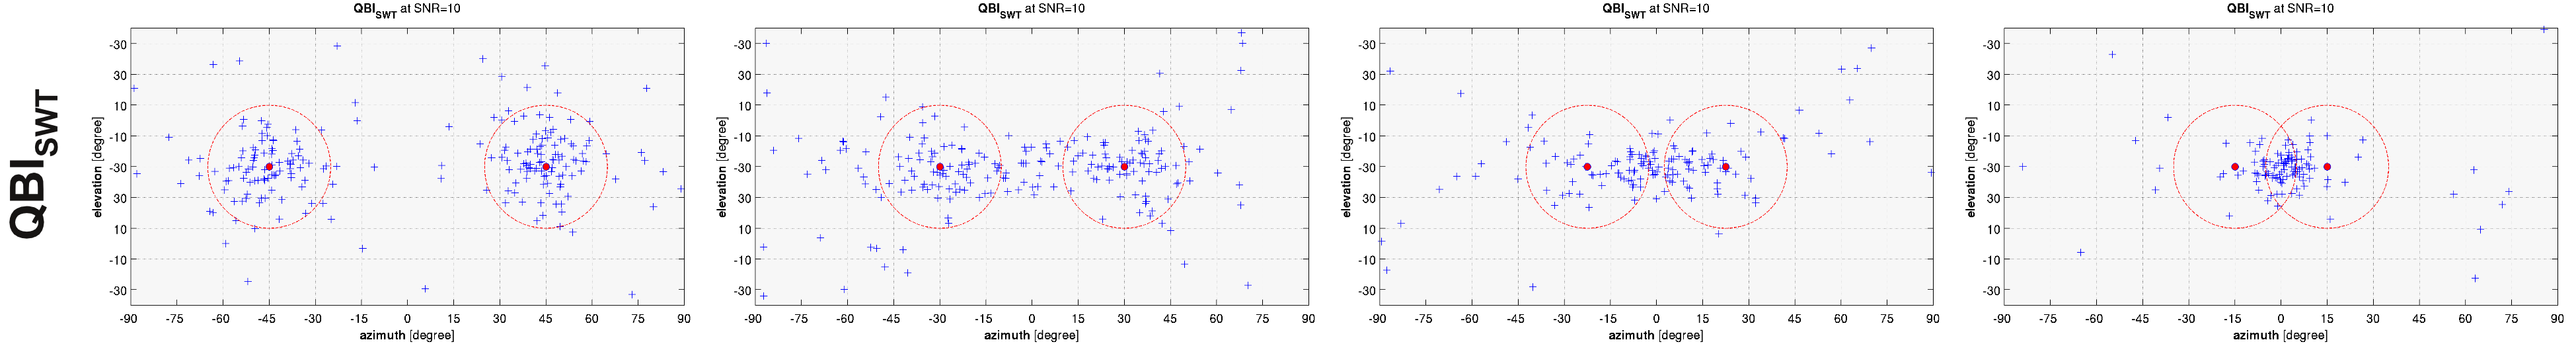
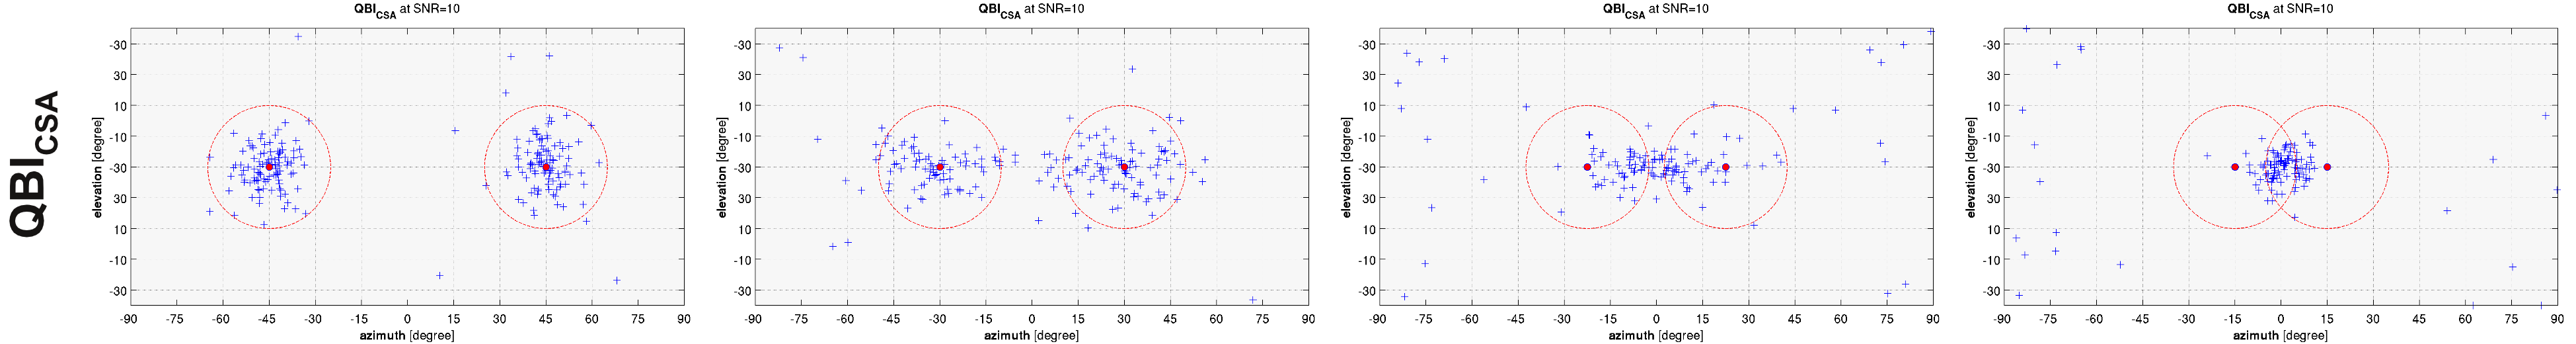
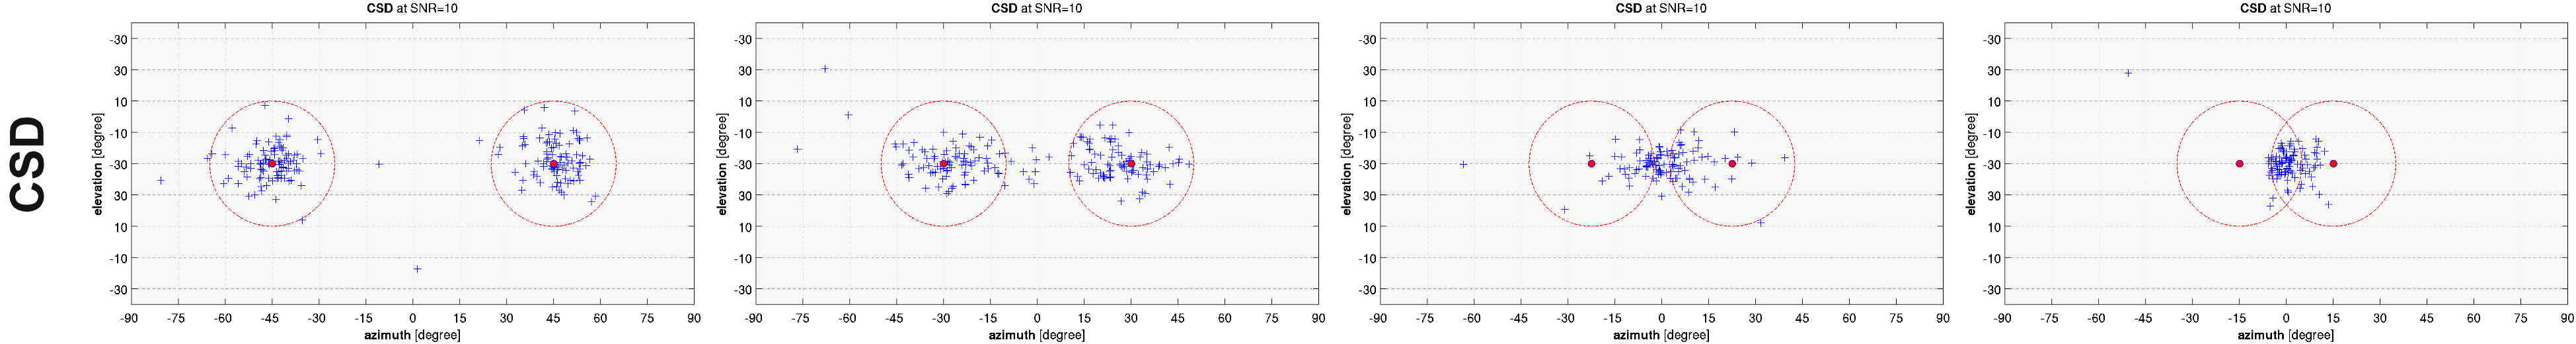
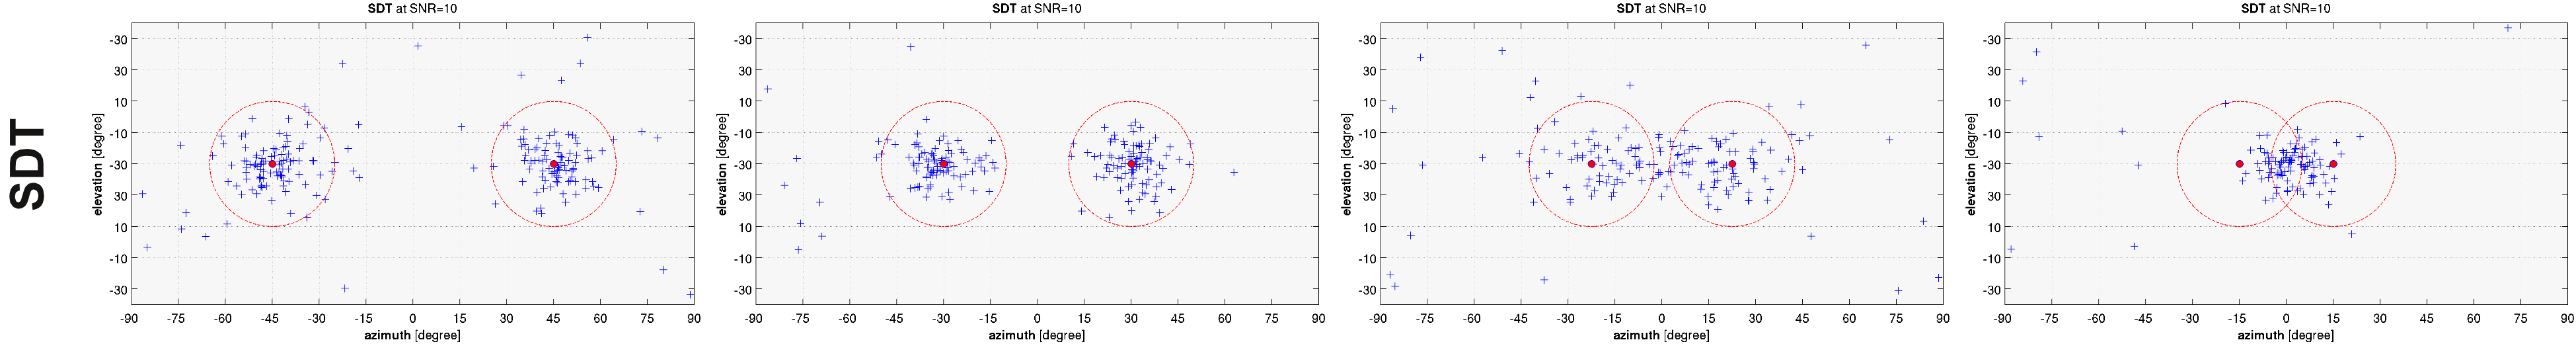
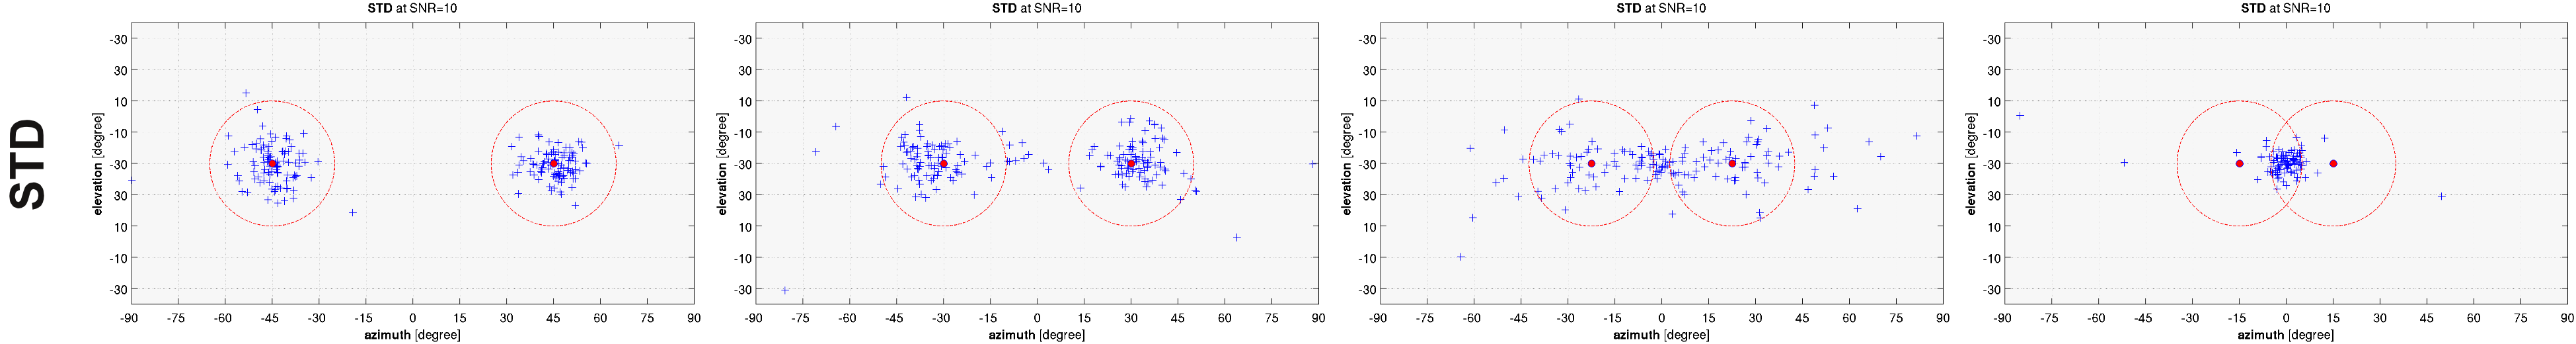
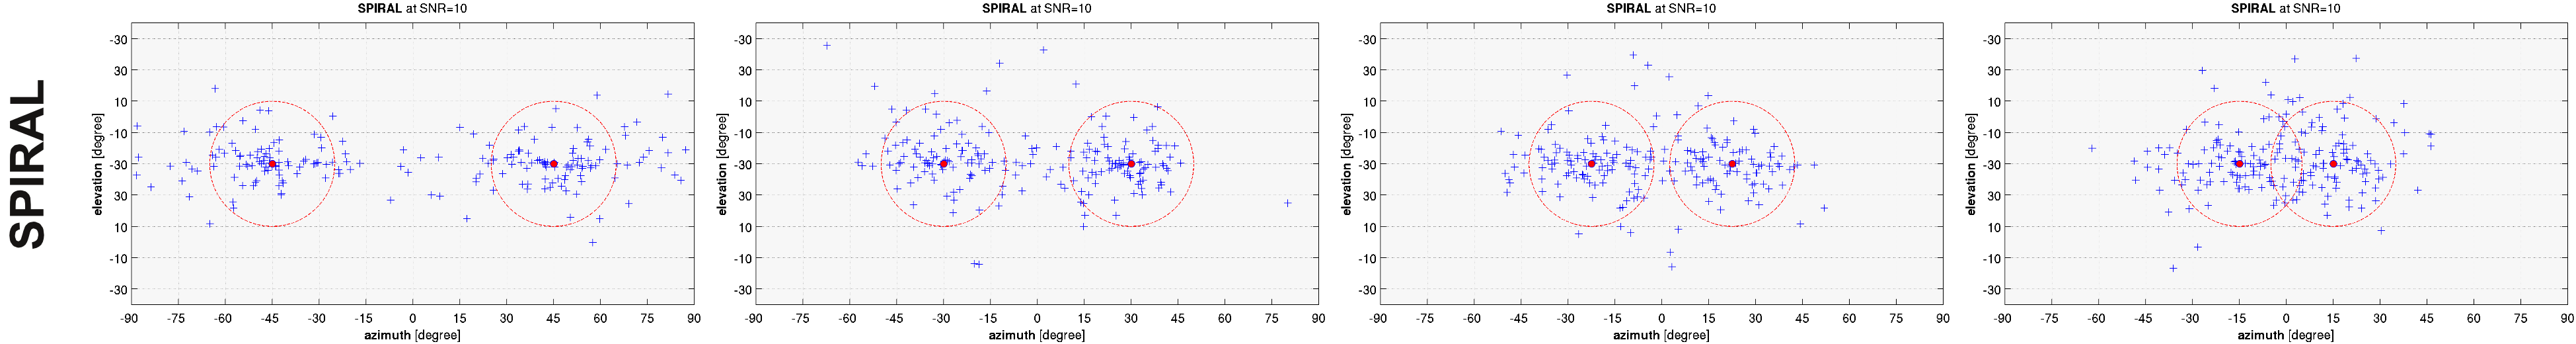
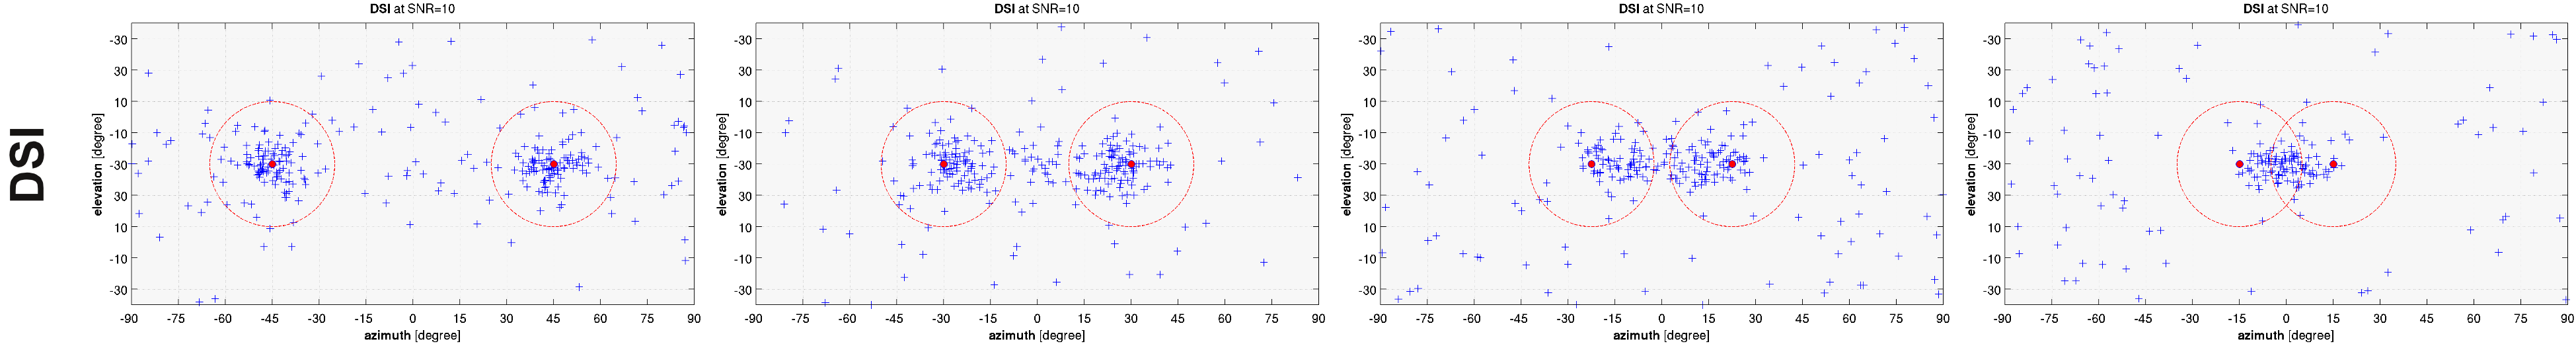
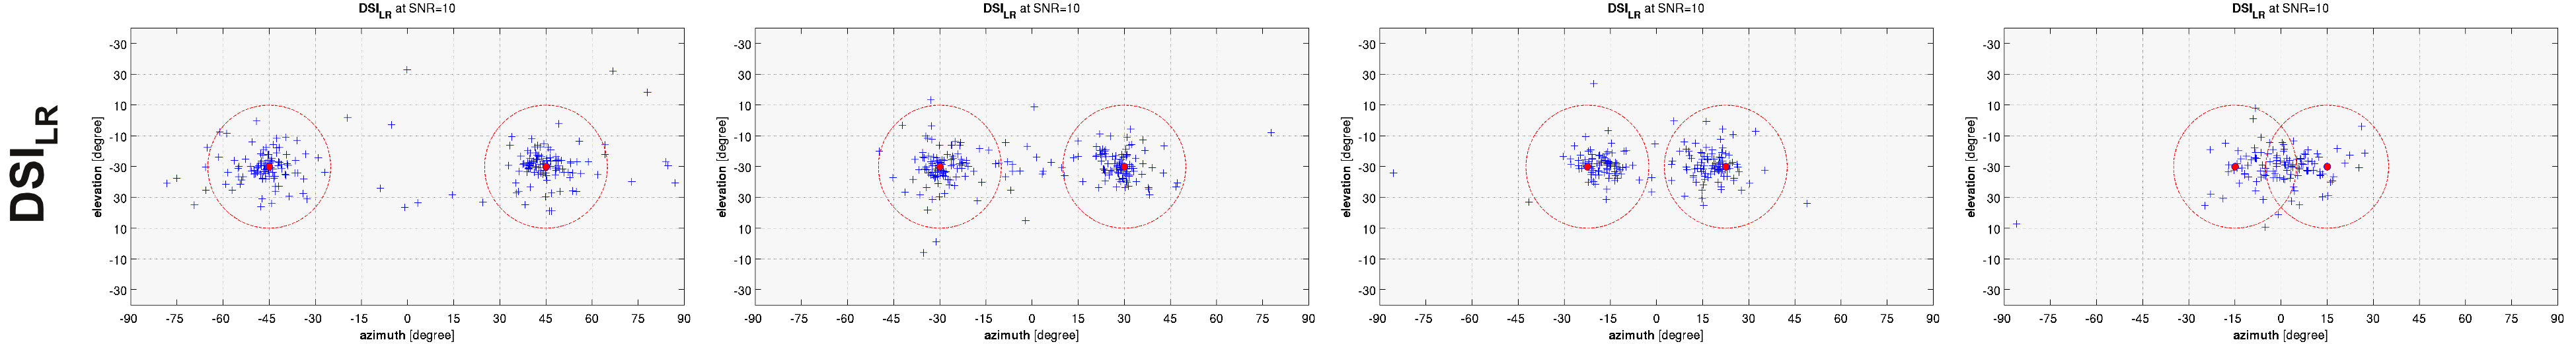
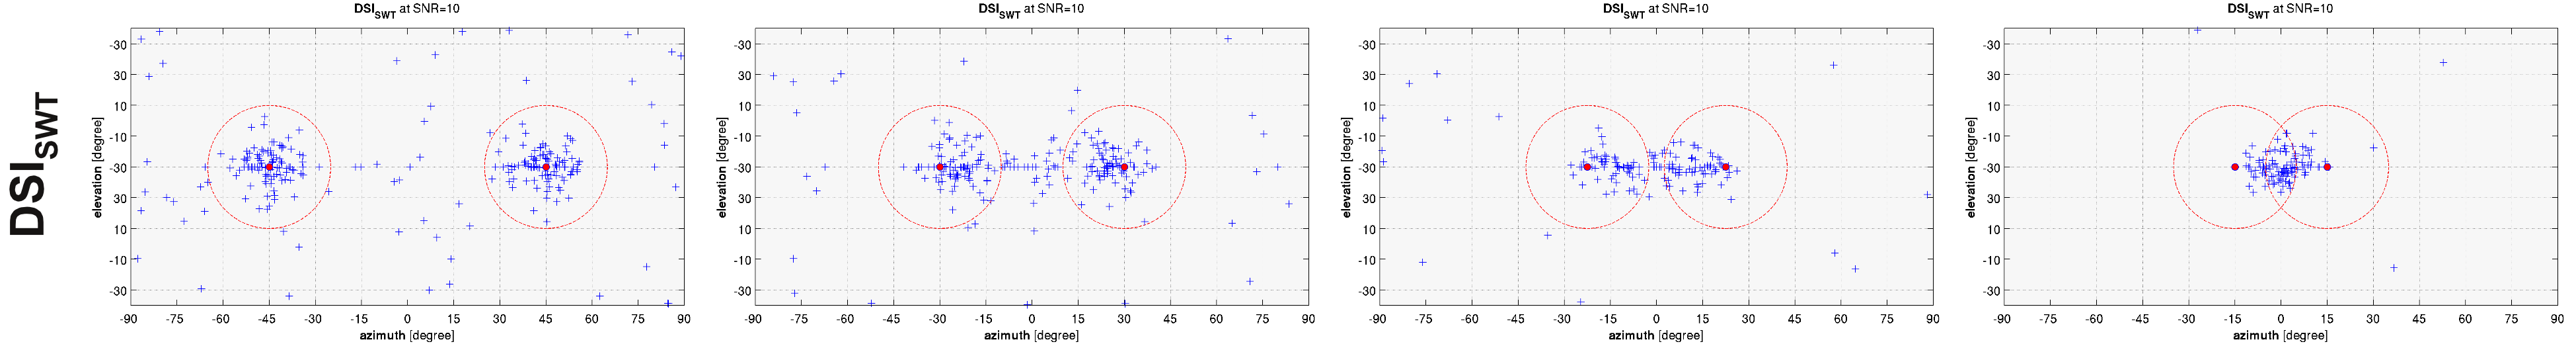
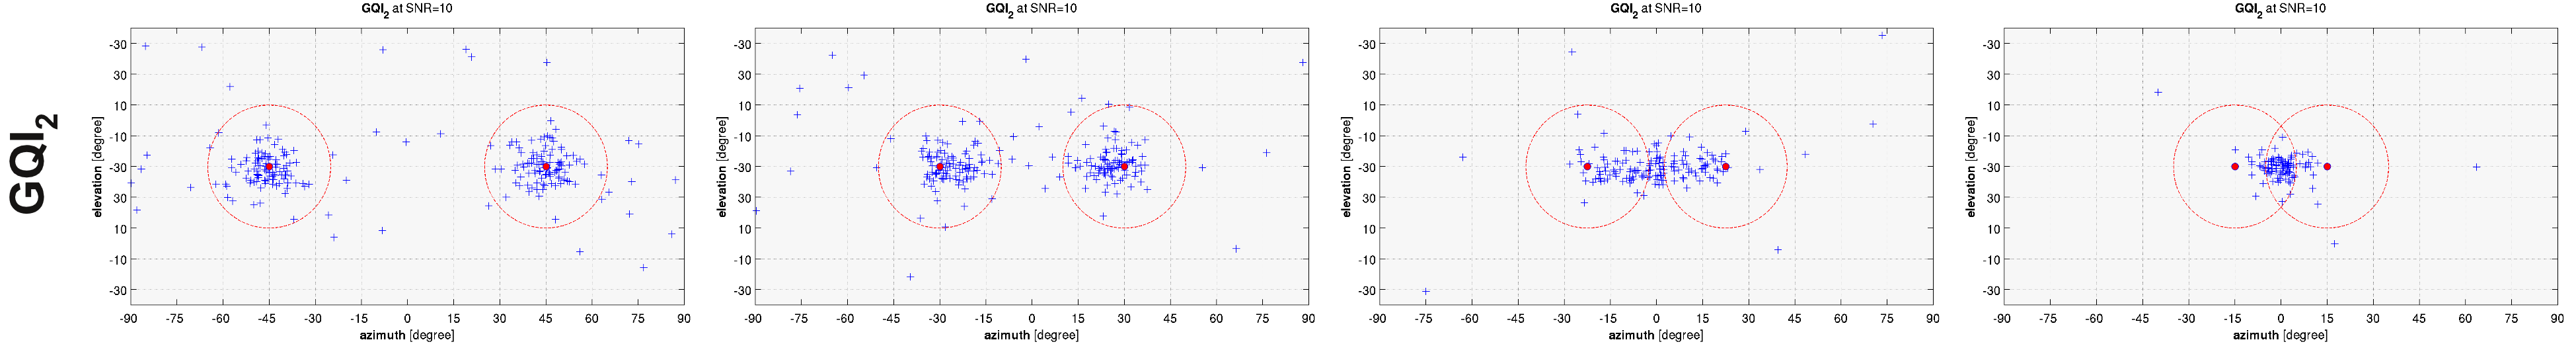
The following plots depict the position of the estimated orientations by means of the azimuthal&elevation plots as in [Tournier2008].
Different crossing configurtions are shown. From left to right:  ,
,  ,
,  and
and  .
The red lines identify, as a reference, the tolerance cone around each ground-truth fiber population (red dots) that was used in this work (
.
The red lines identify, as a reference, the tolerance cone around each ground-truth fiber population (red dots) that was used in this work ( ).
Results are reported for three different noise levels.
).
Results are reported for three different noise levels.
References
| [Tournier2008] | Tournier et al. Resolving crossing fibres using constrained spherical deconvolution: Validation using diffusion-weighted imaging phantom data. NeuroImage, 42: 617–625 (2008) |