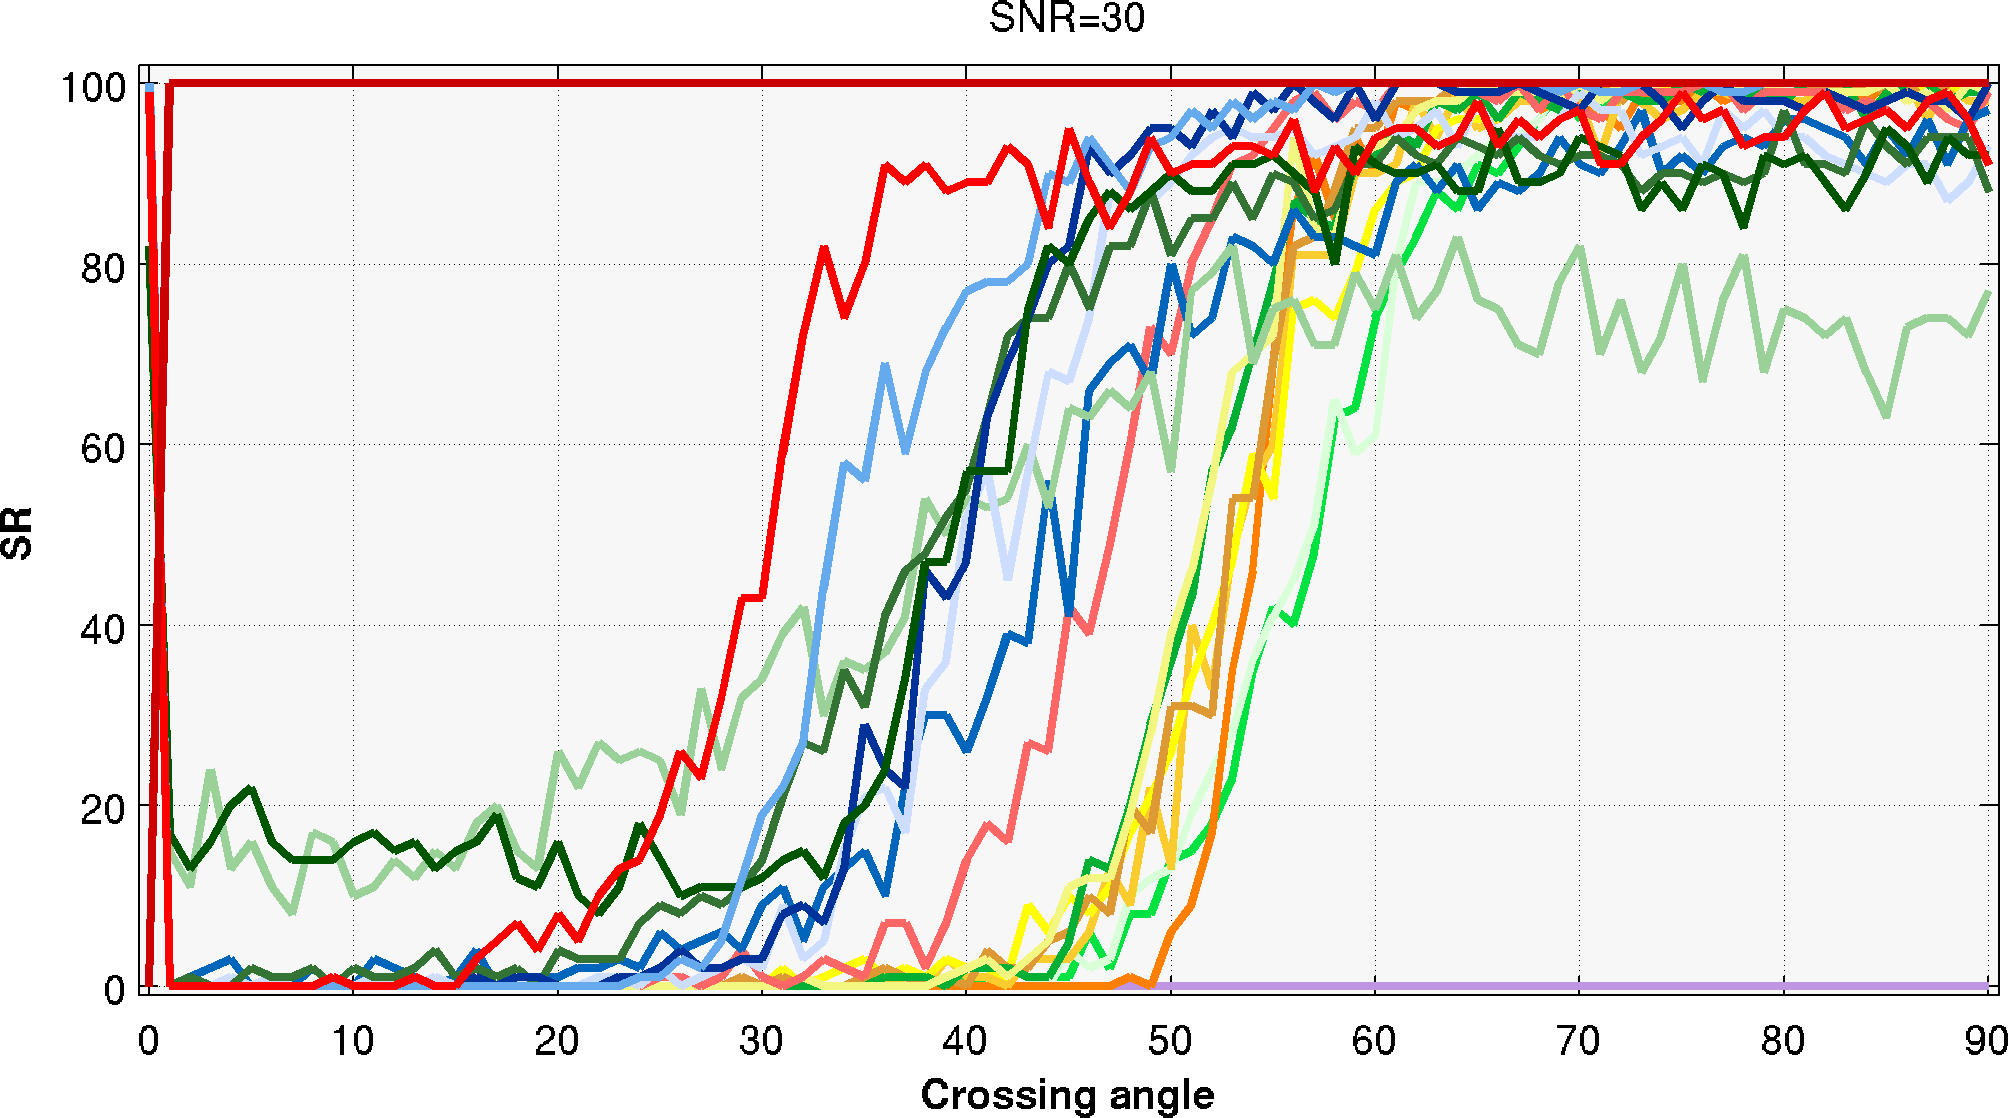
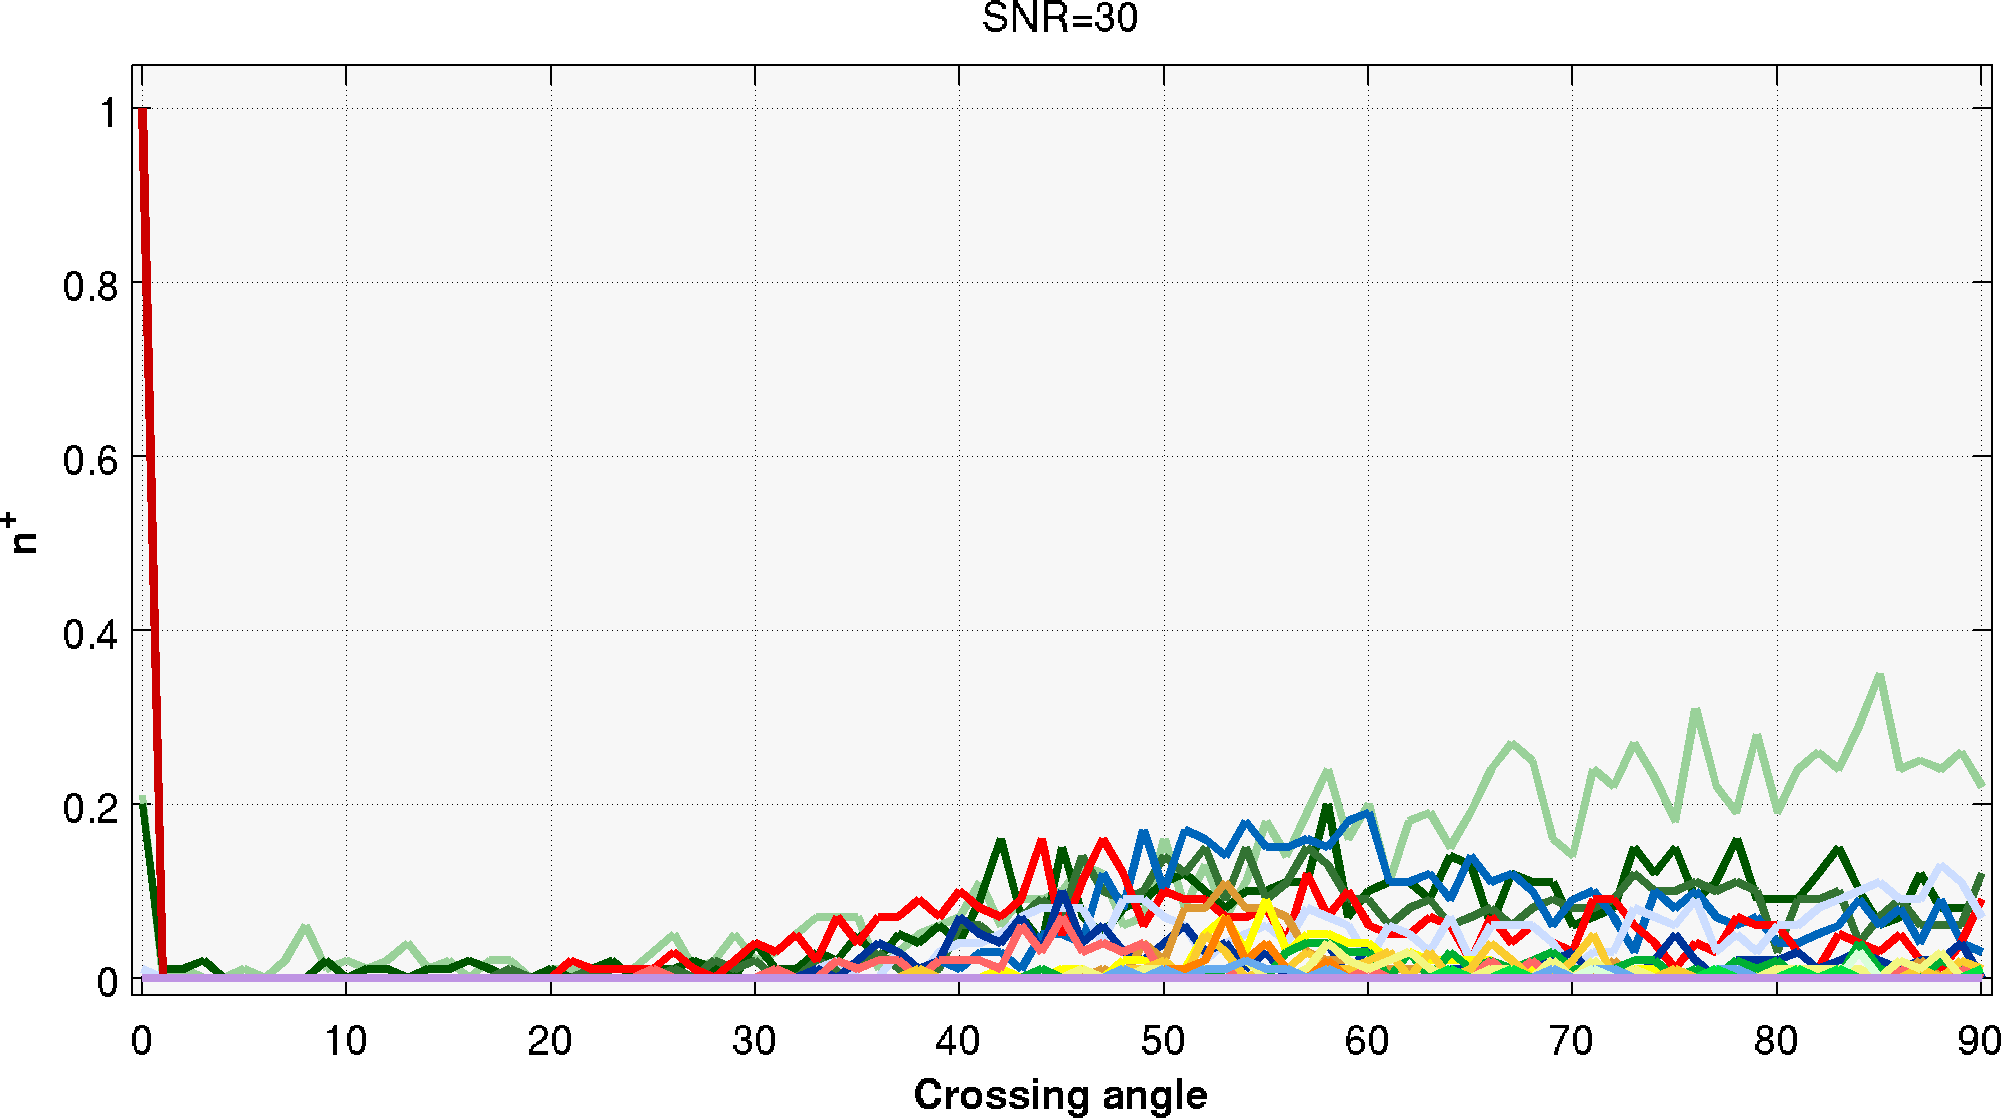
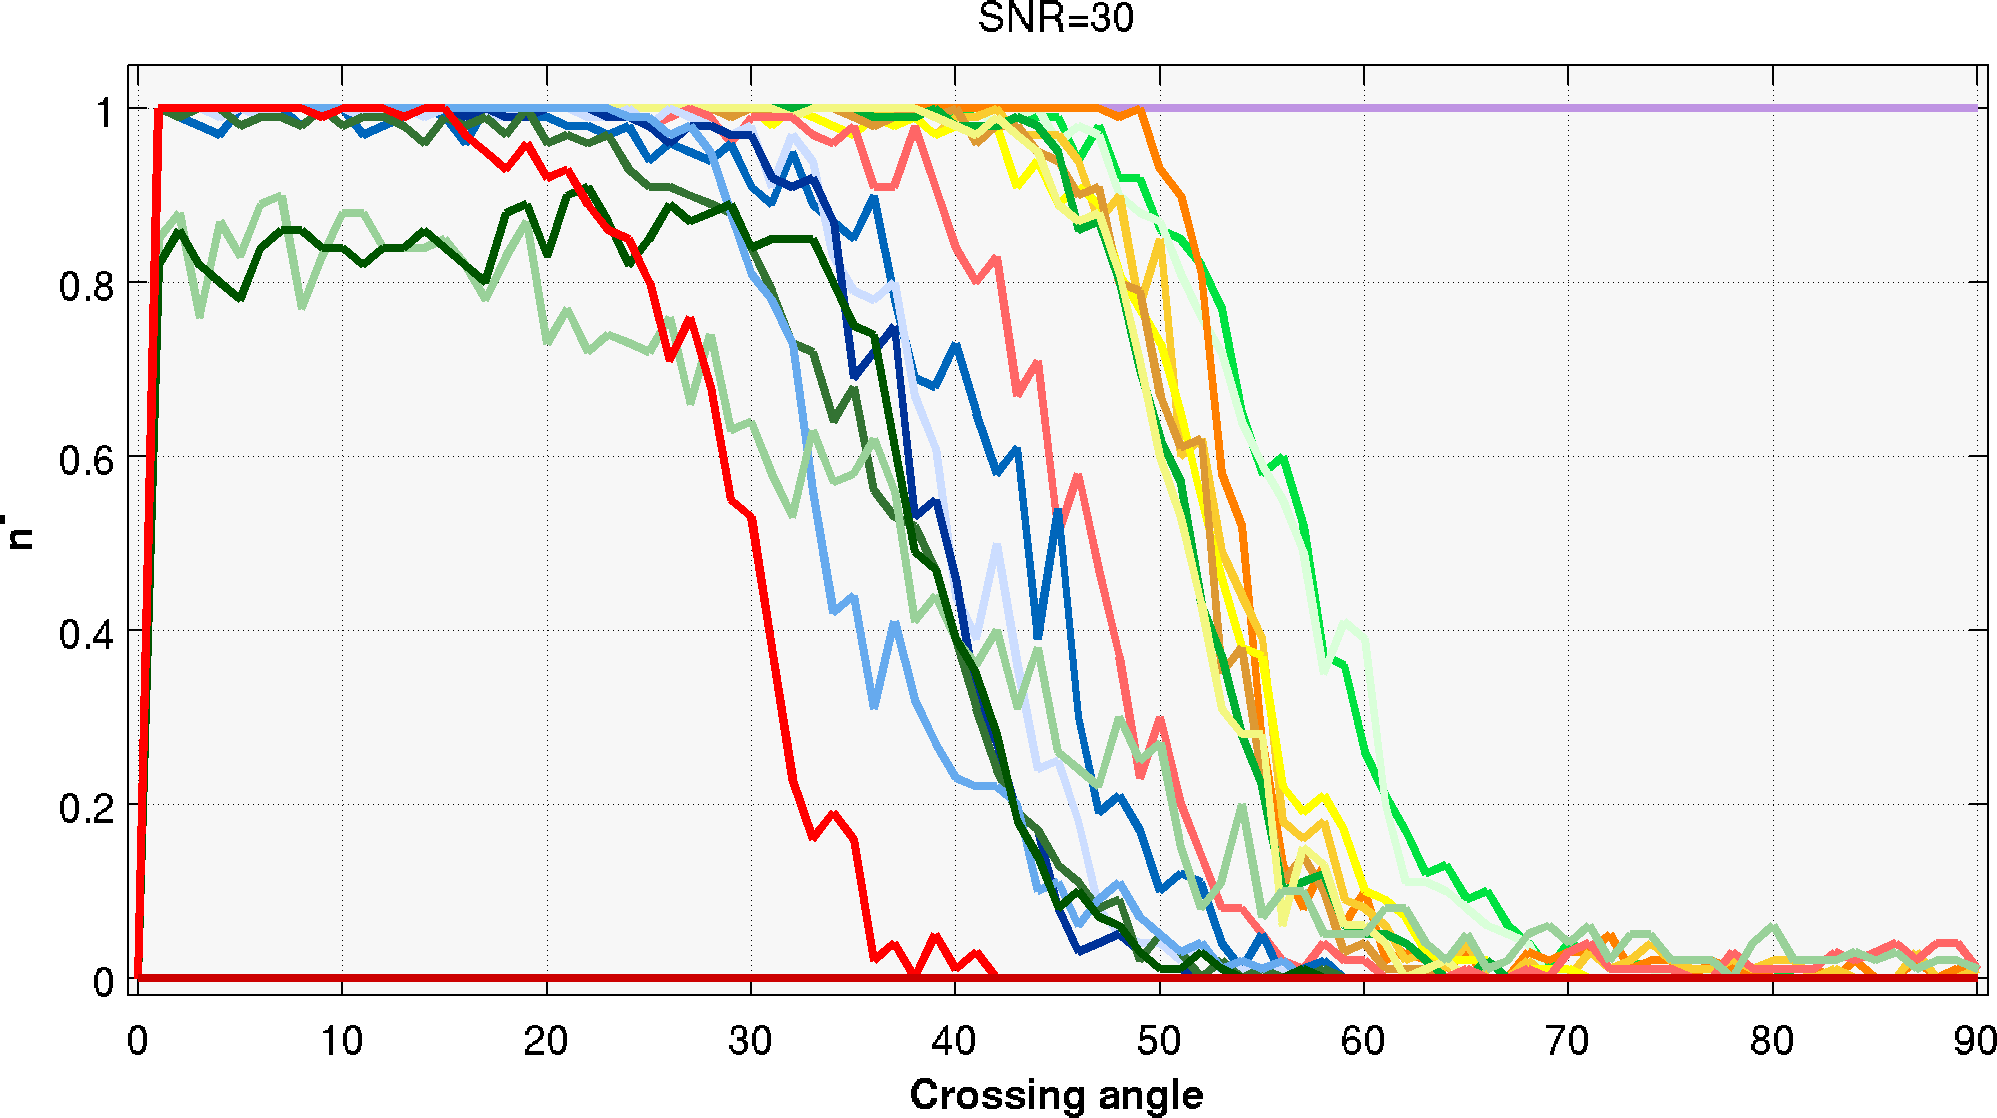
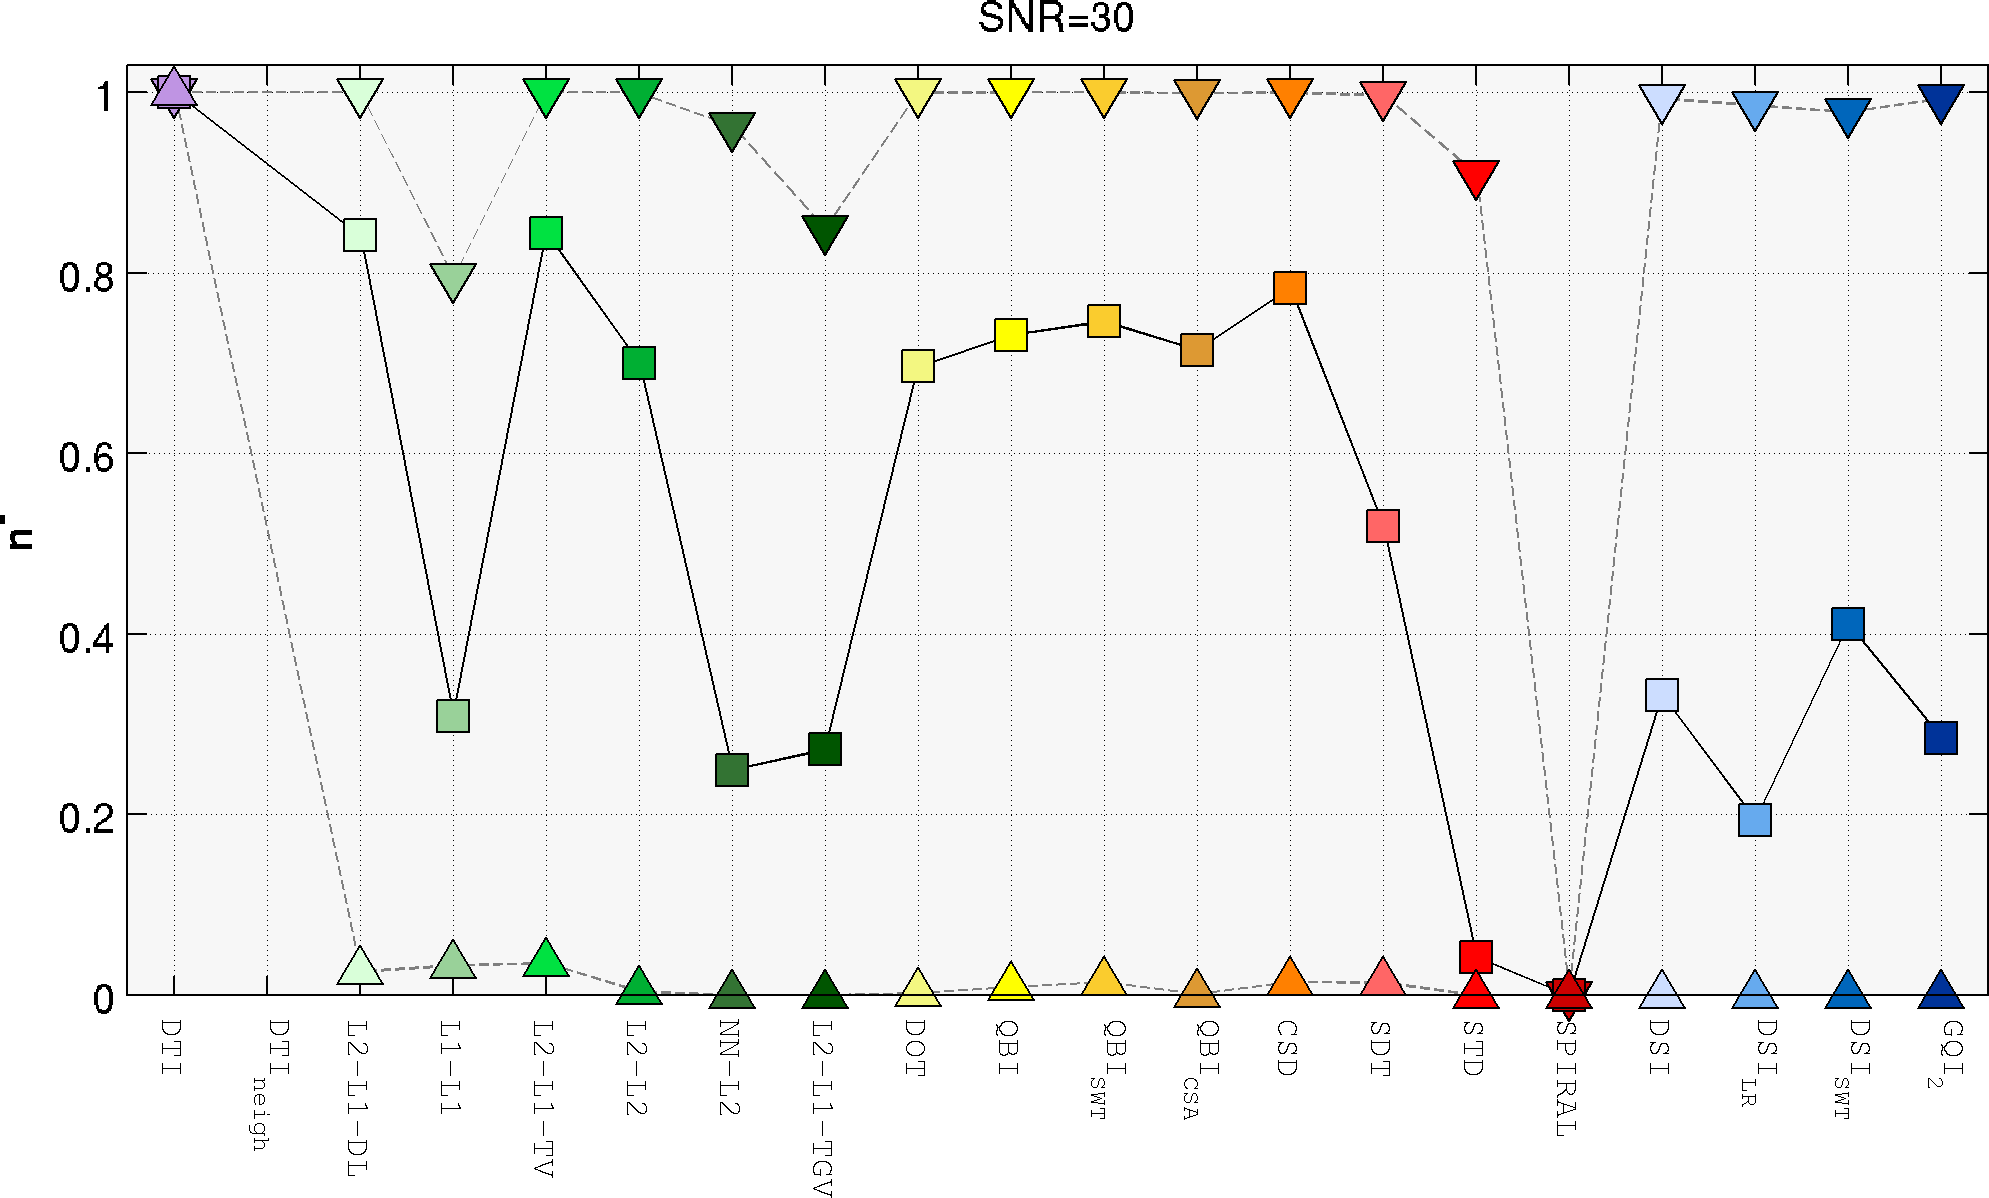
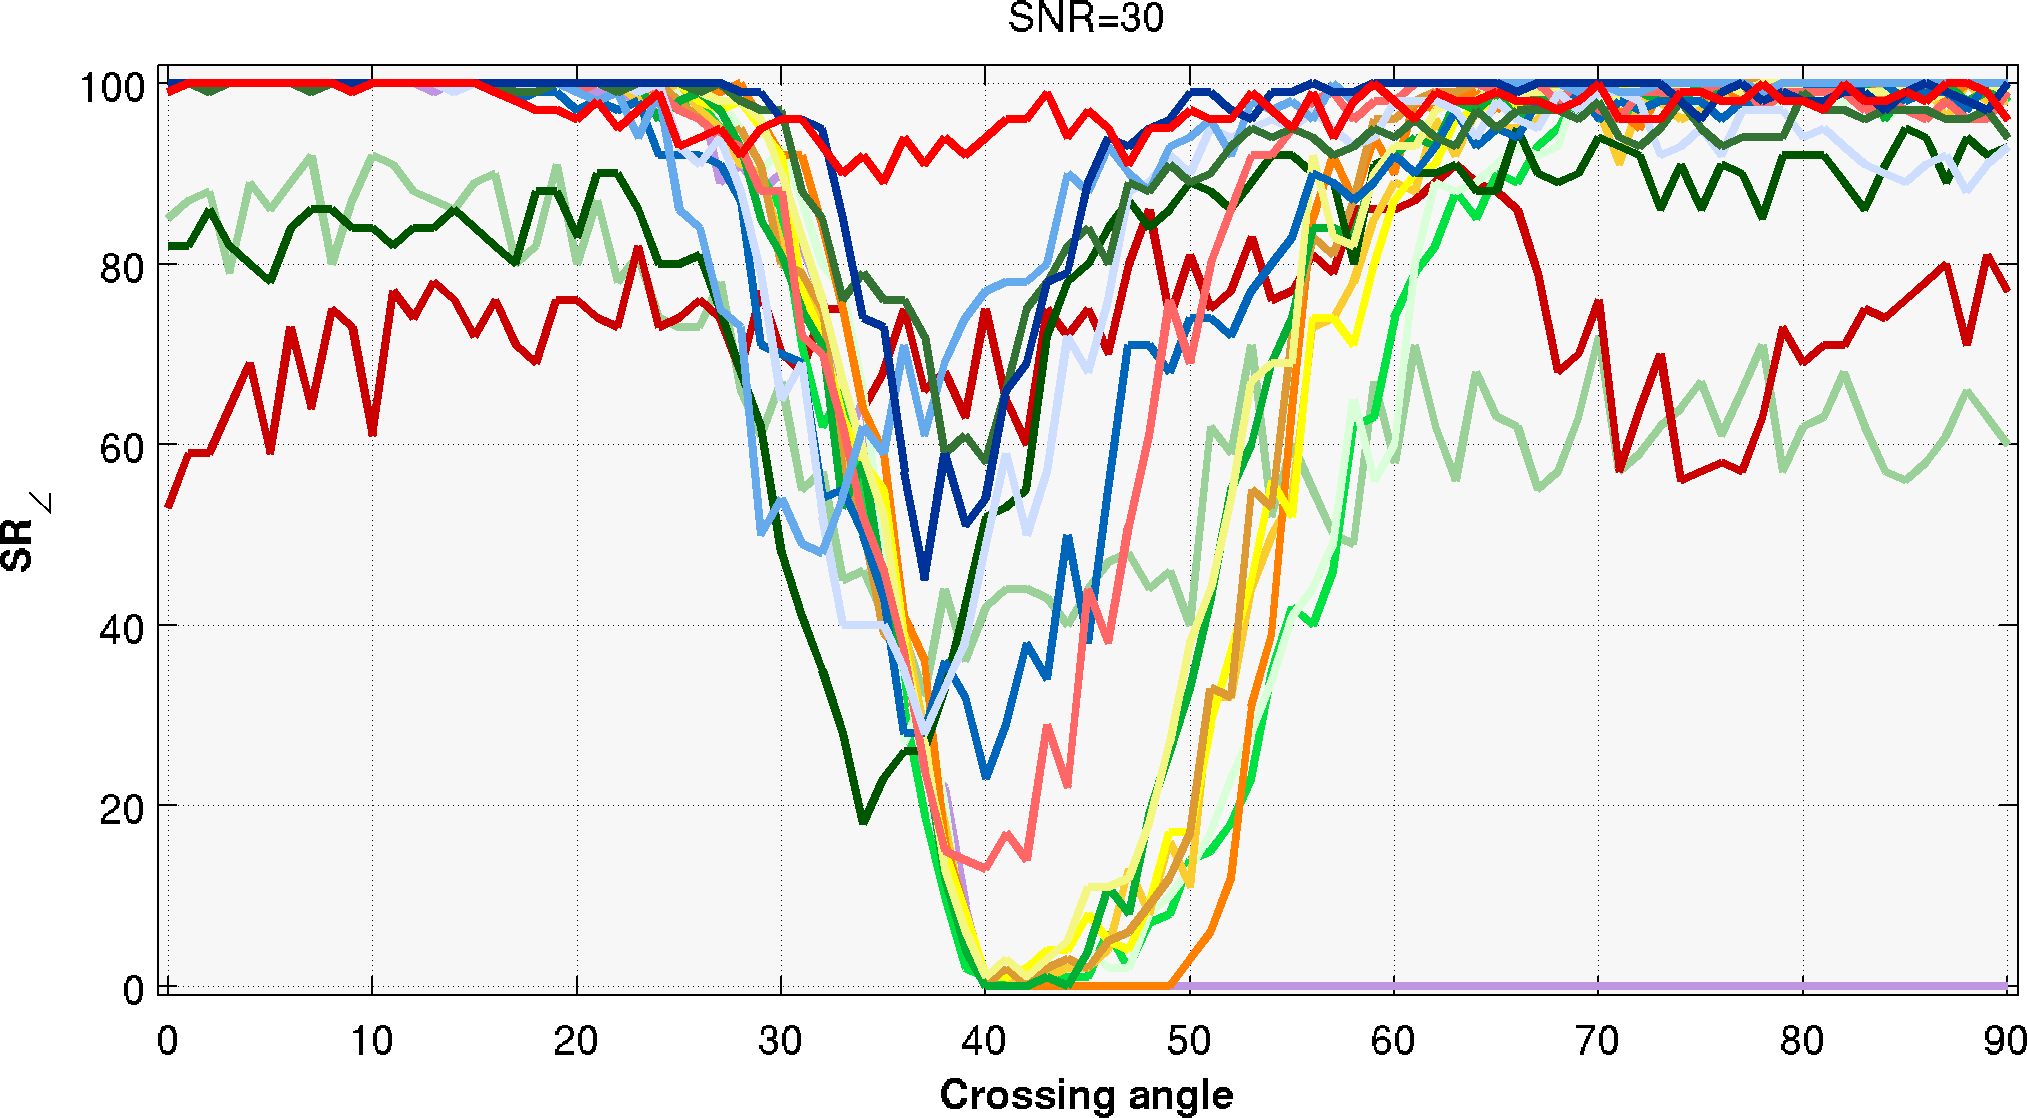
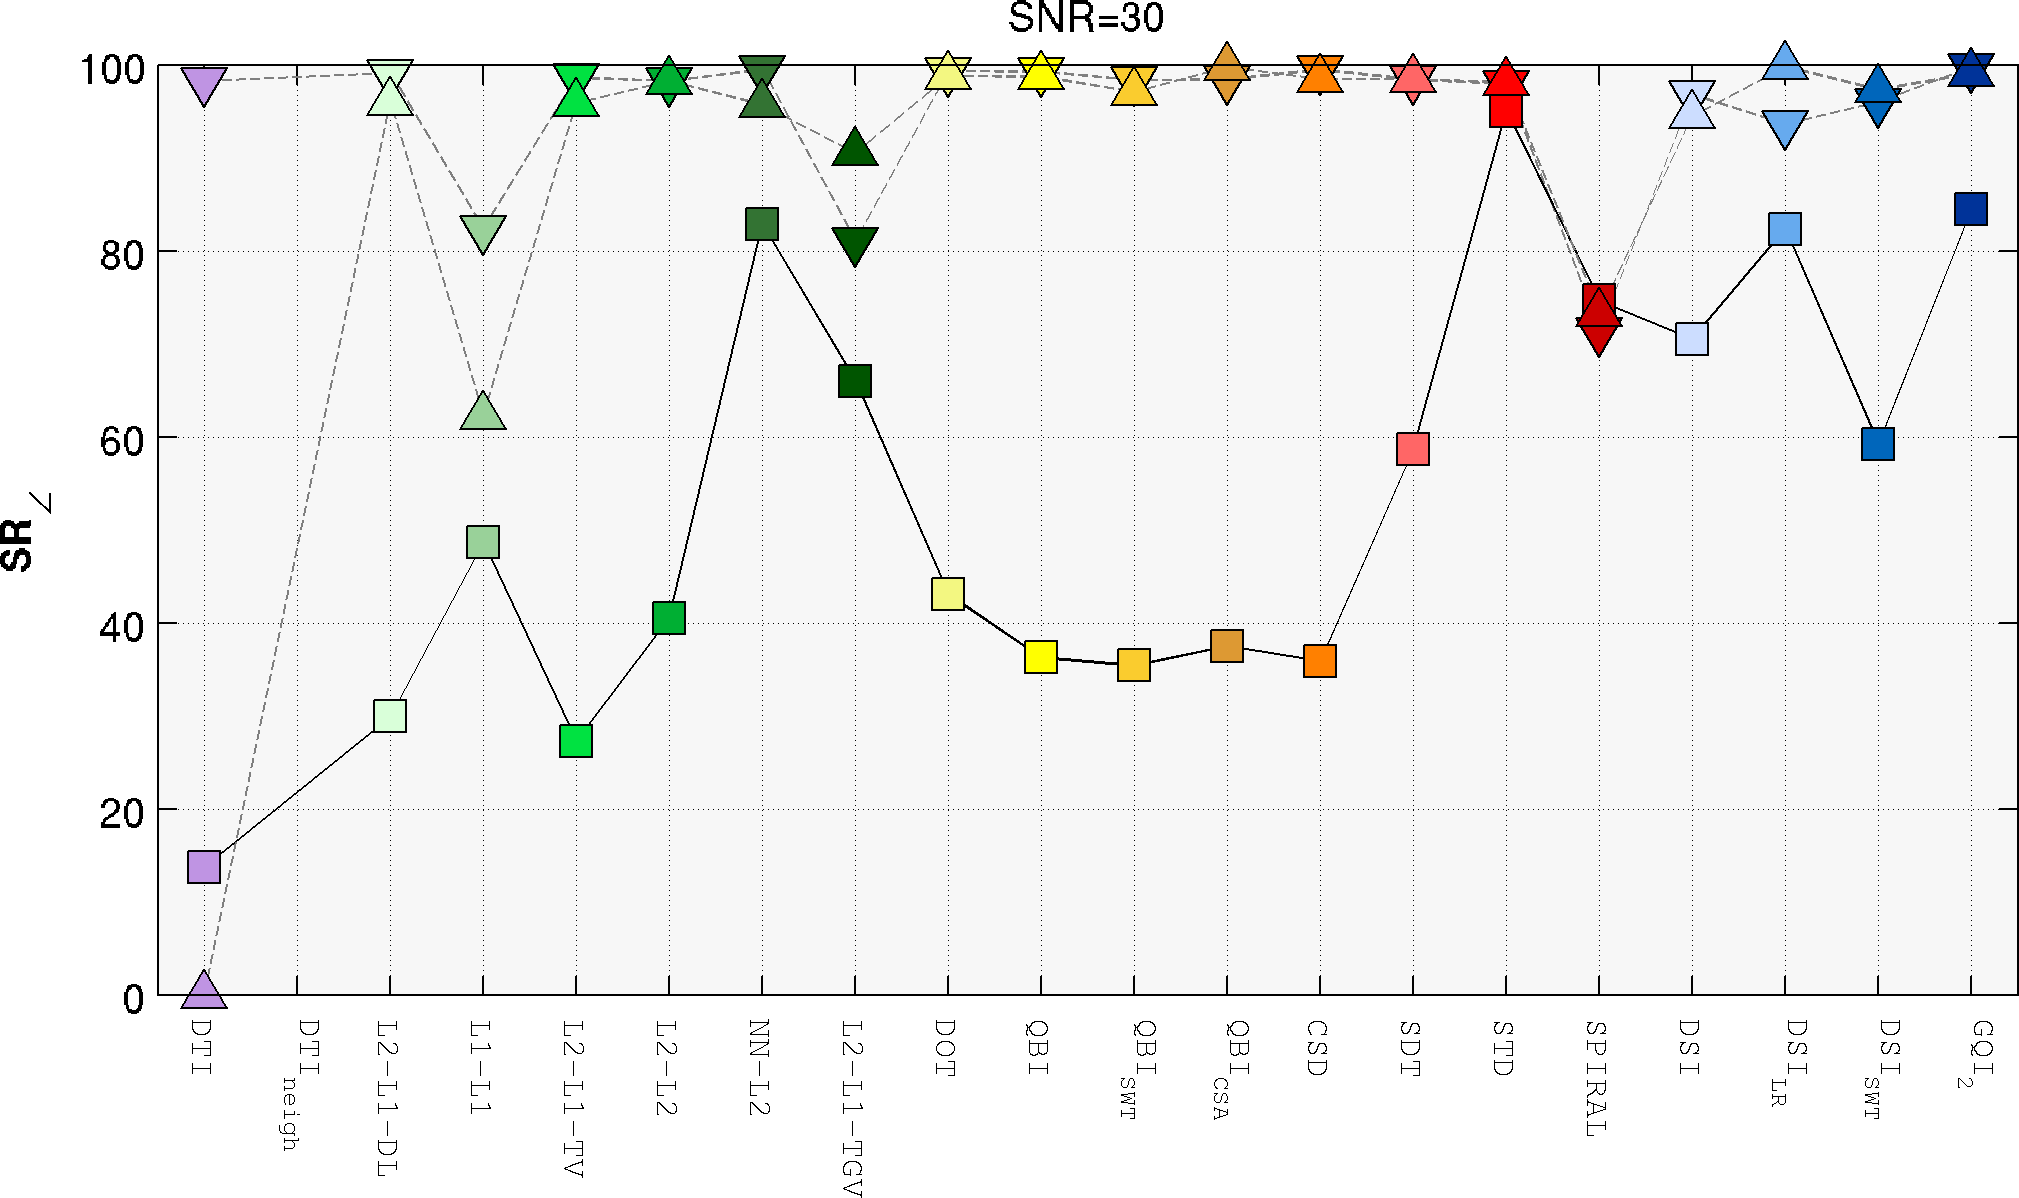
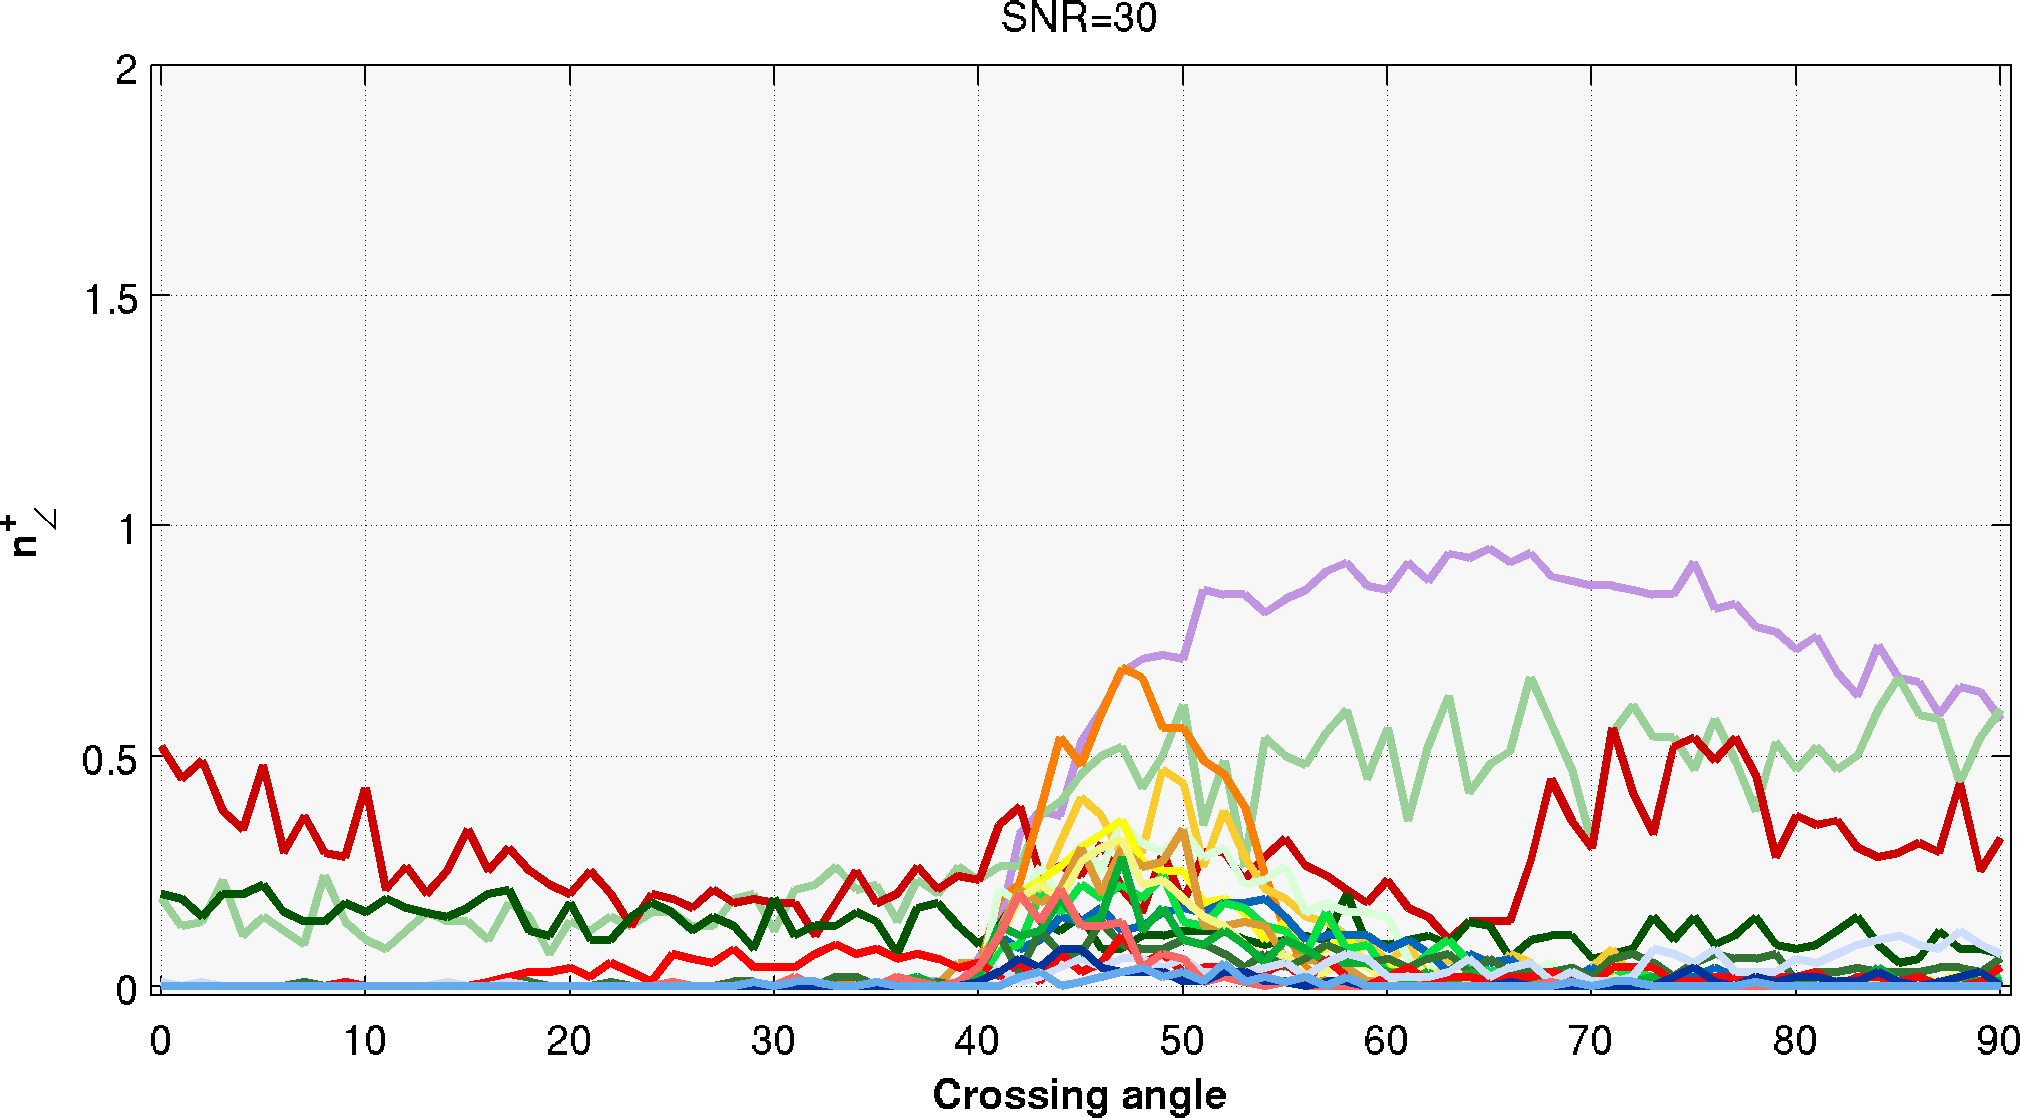
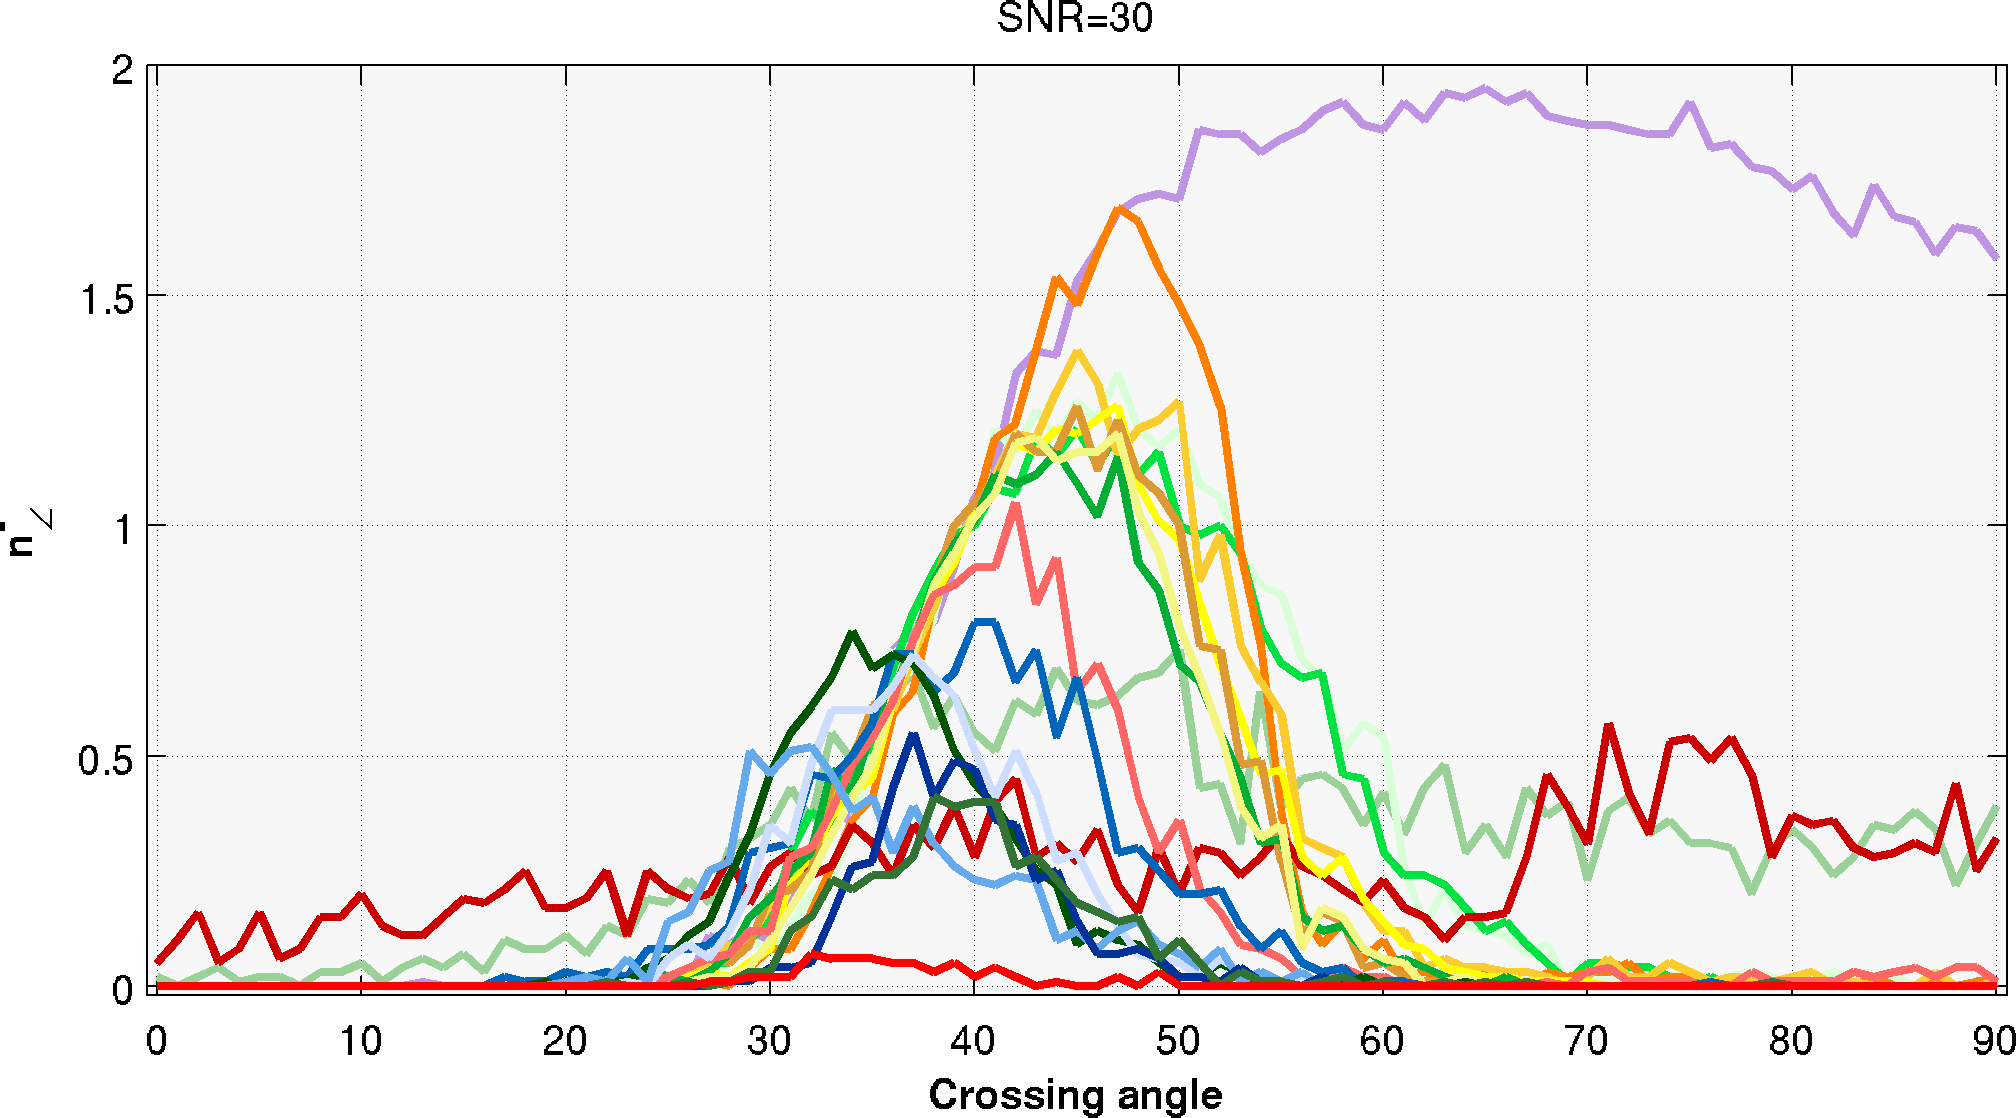
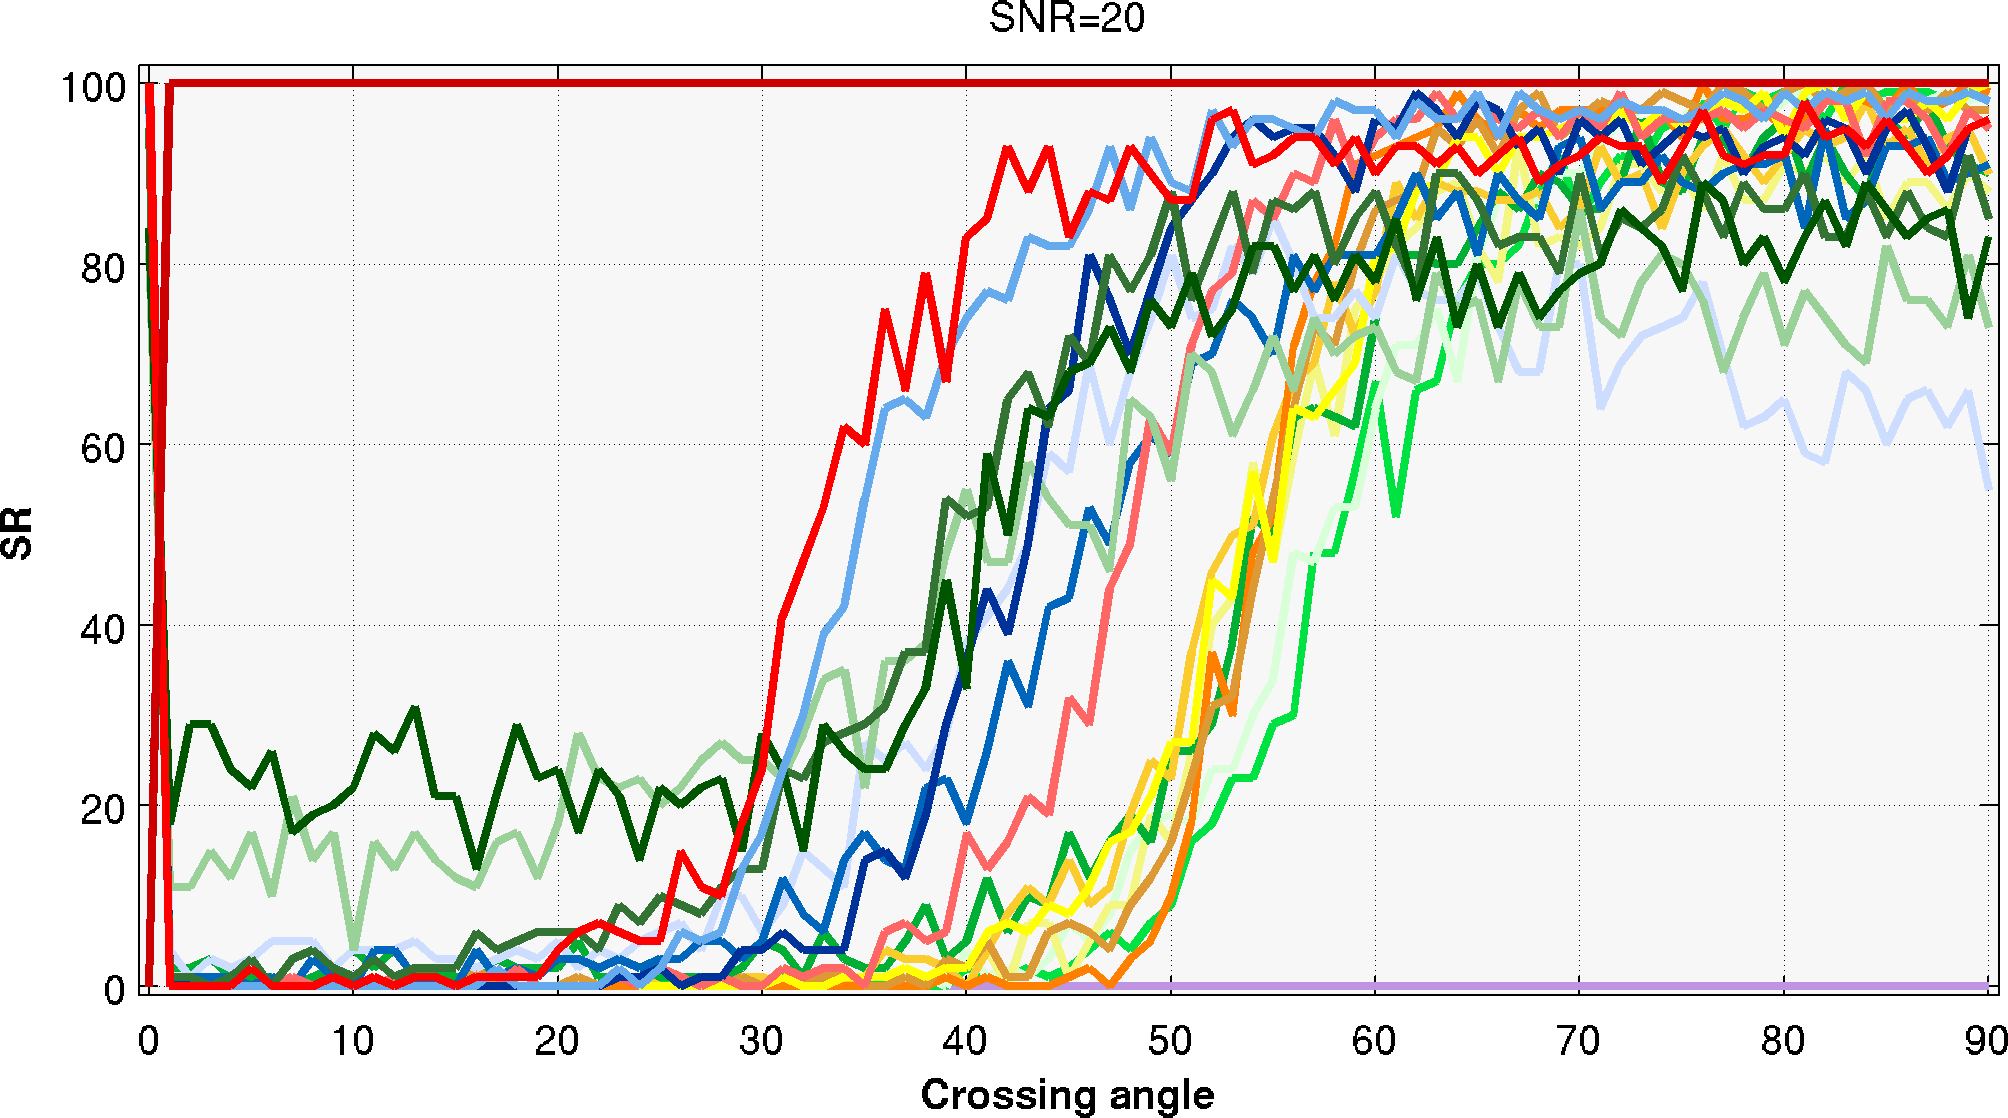
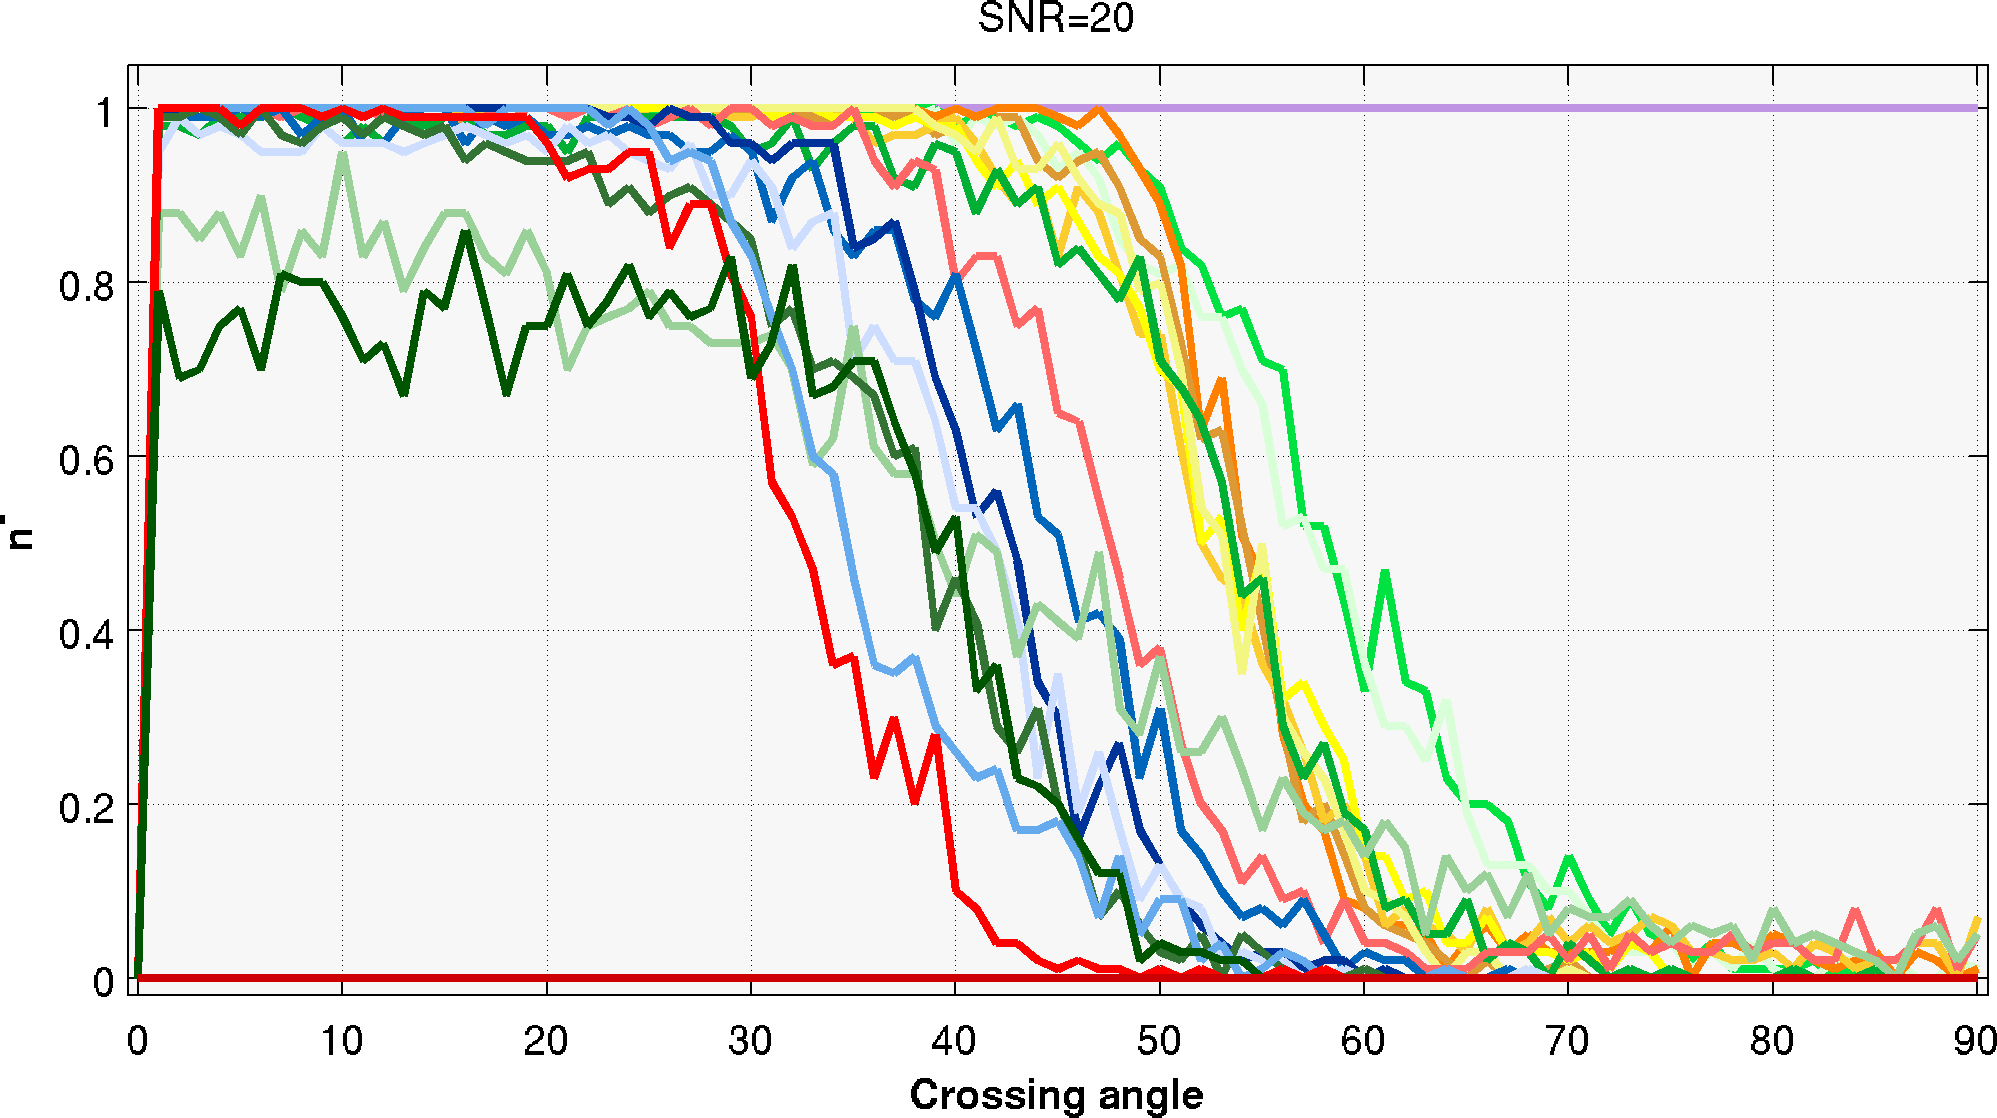
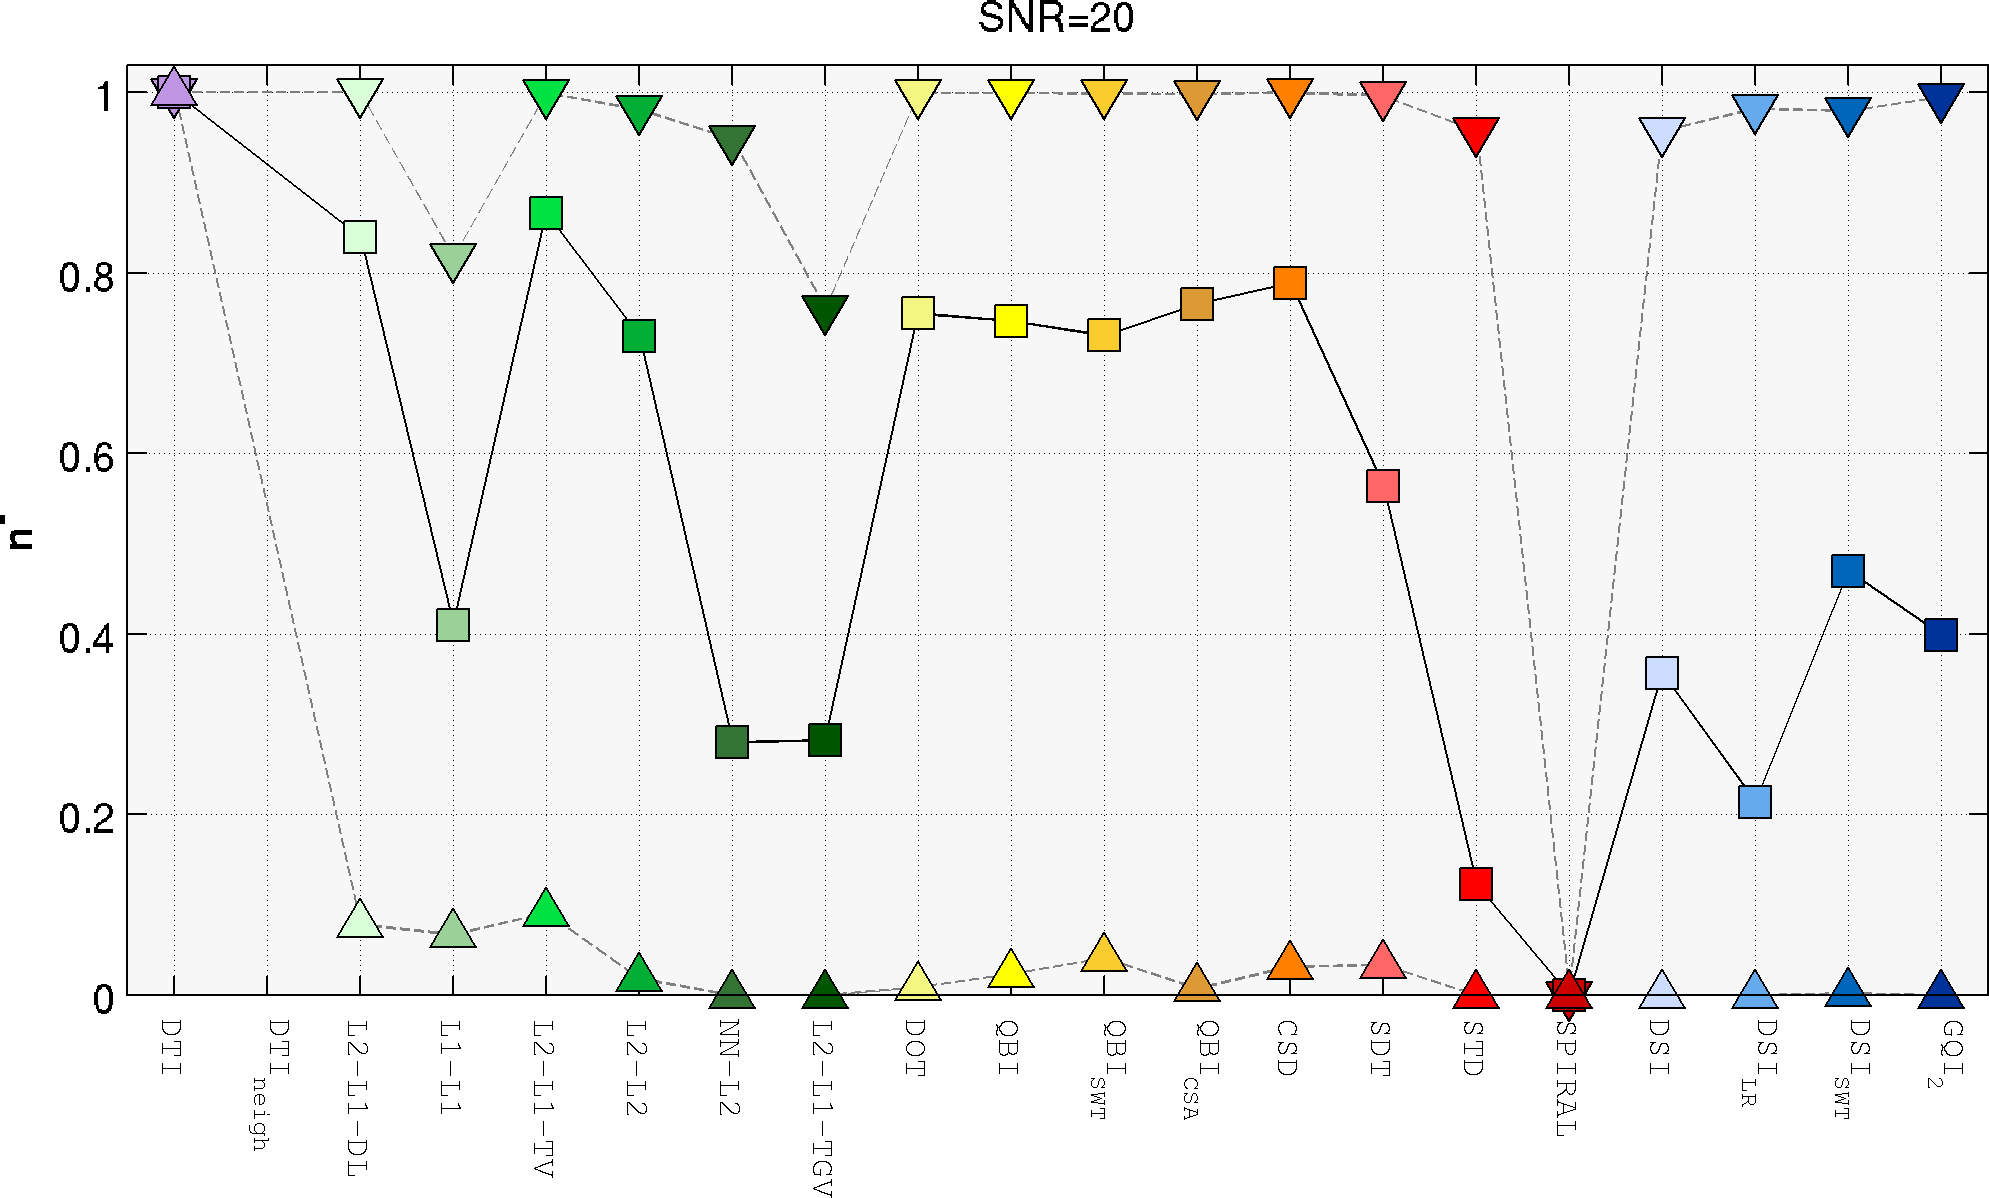
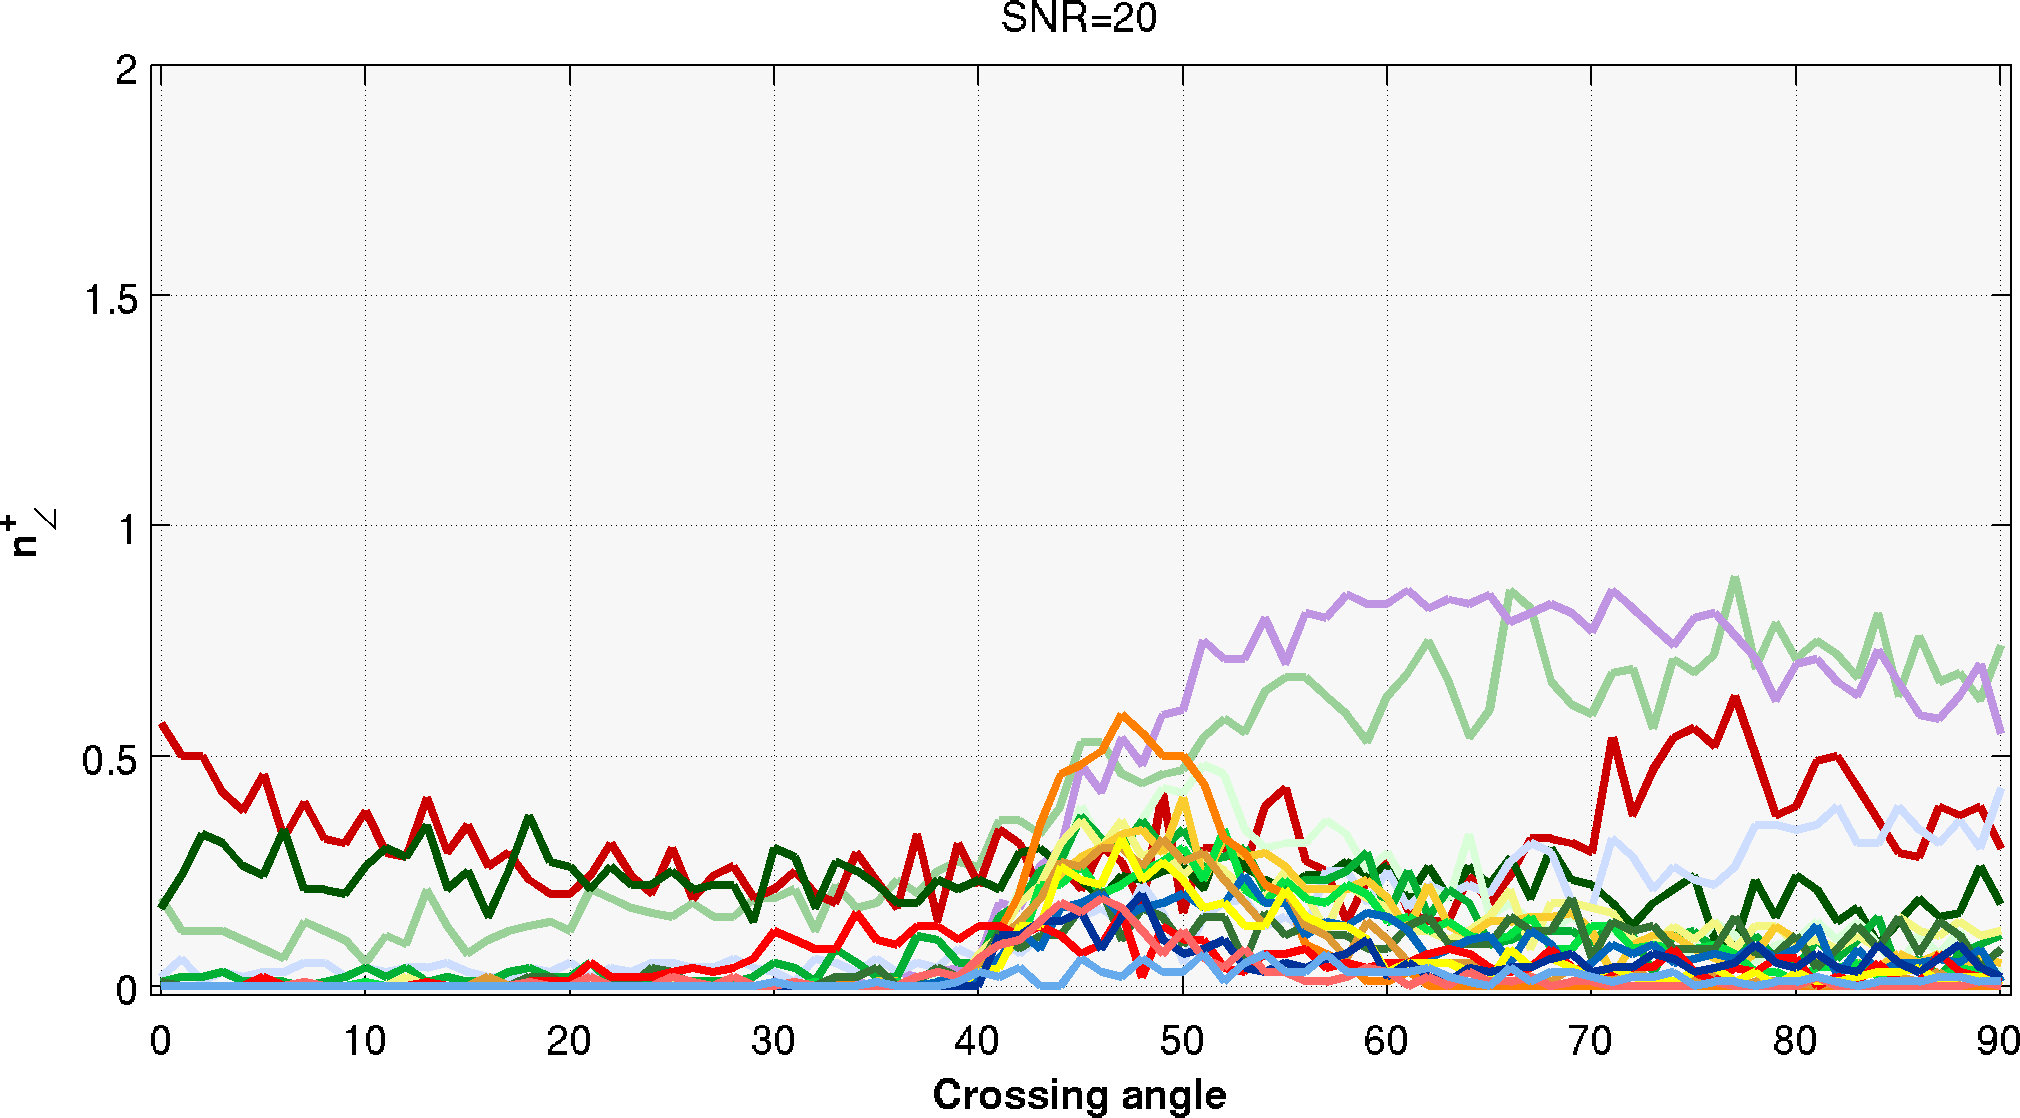
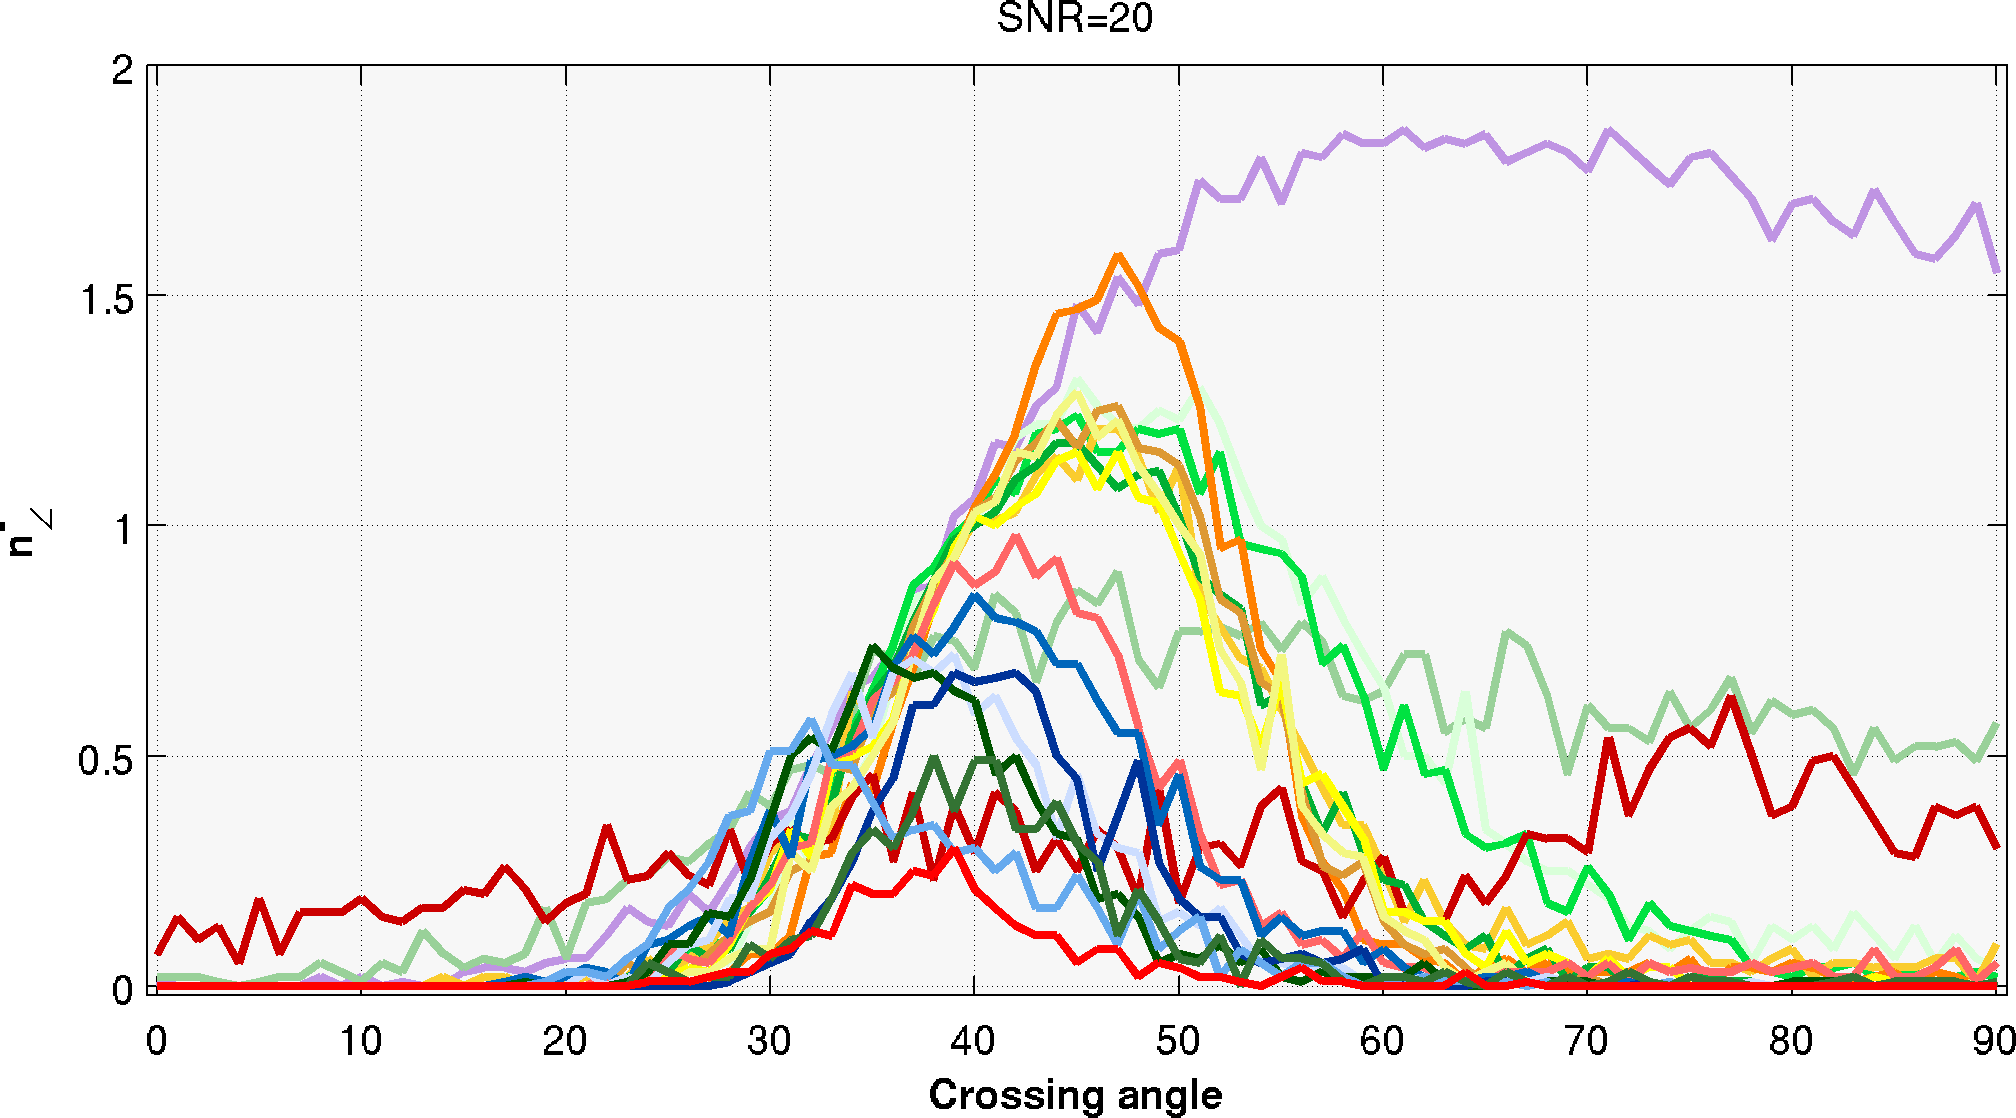
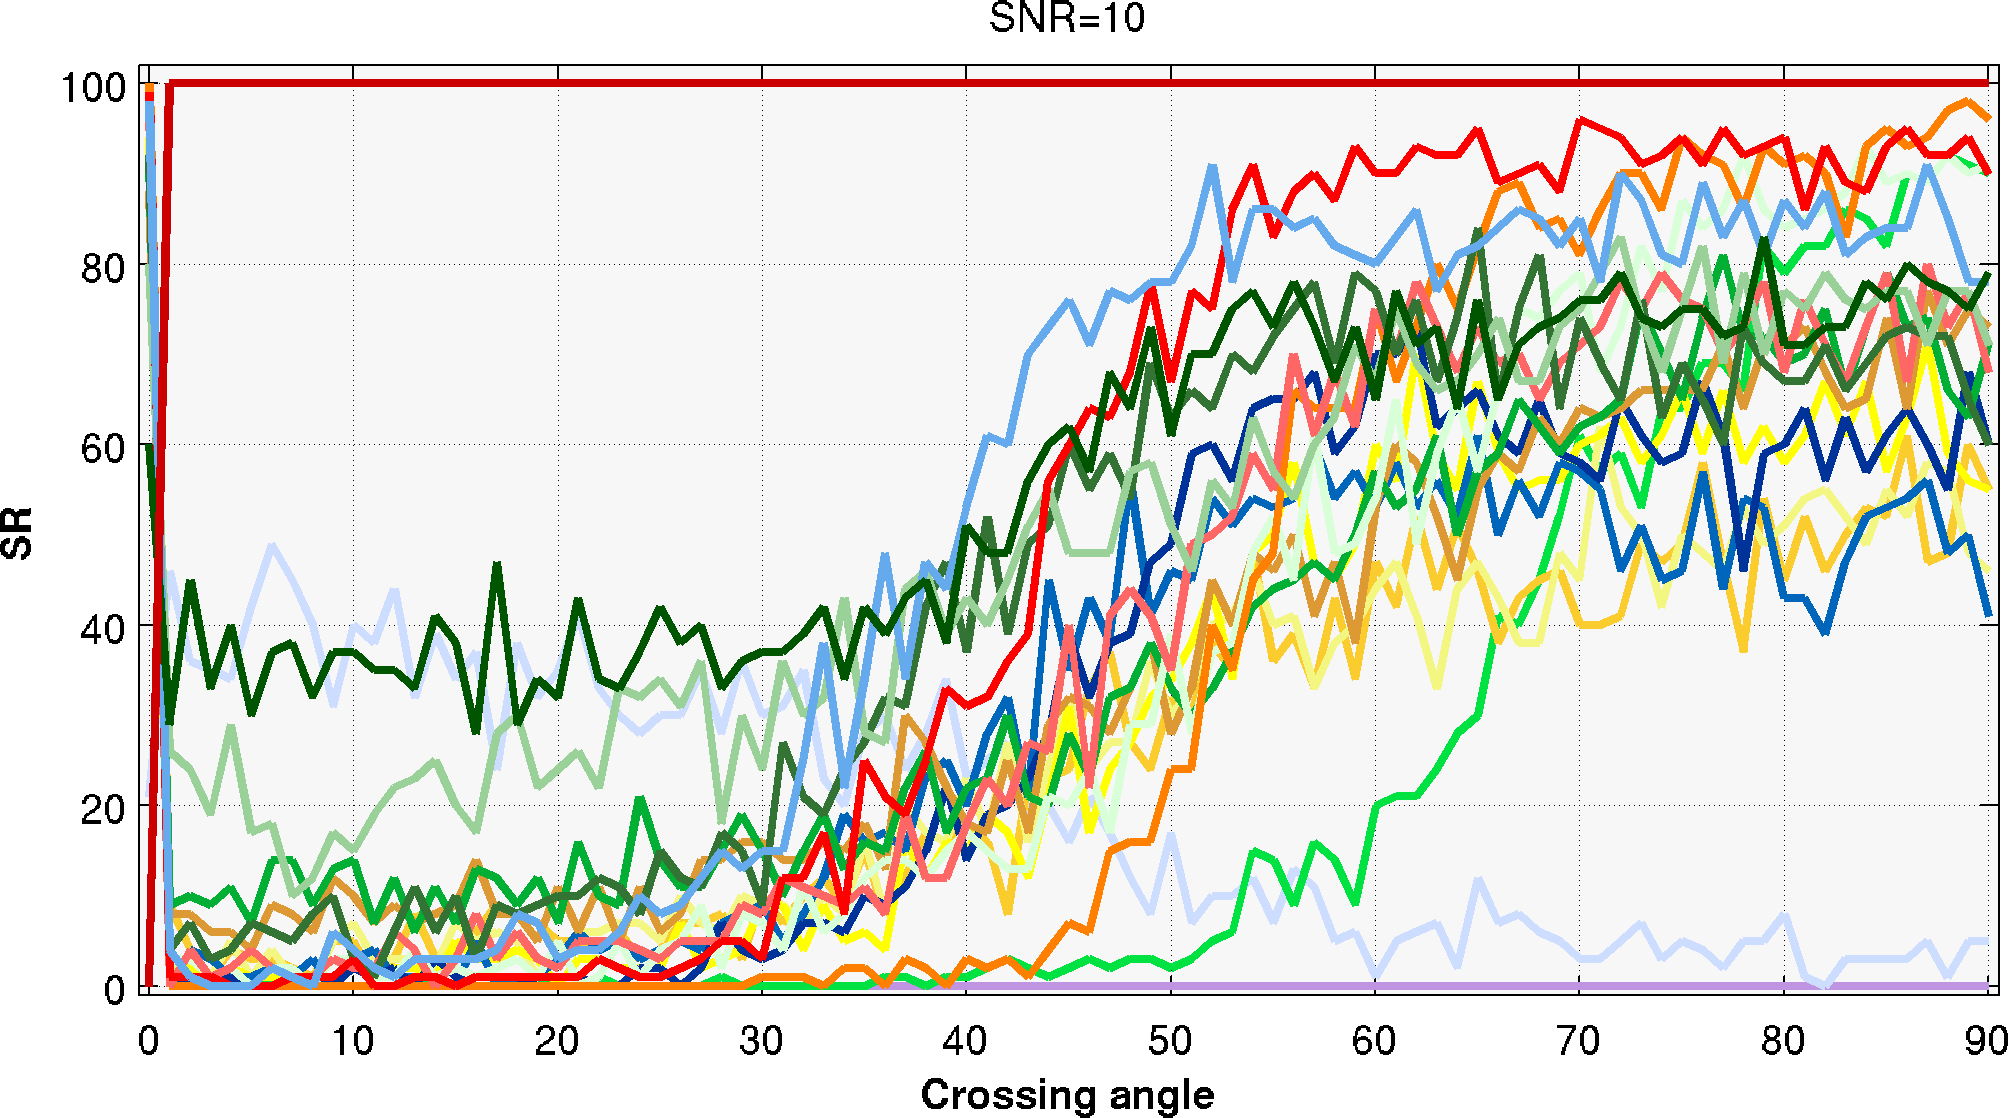
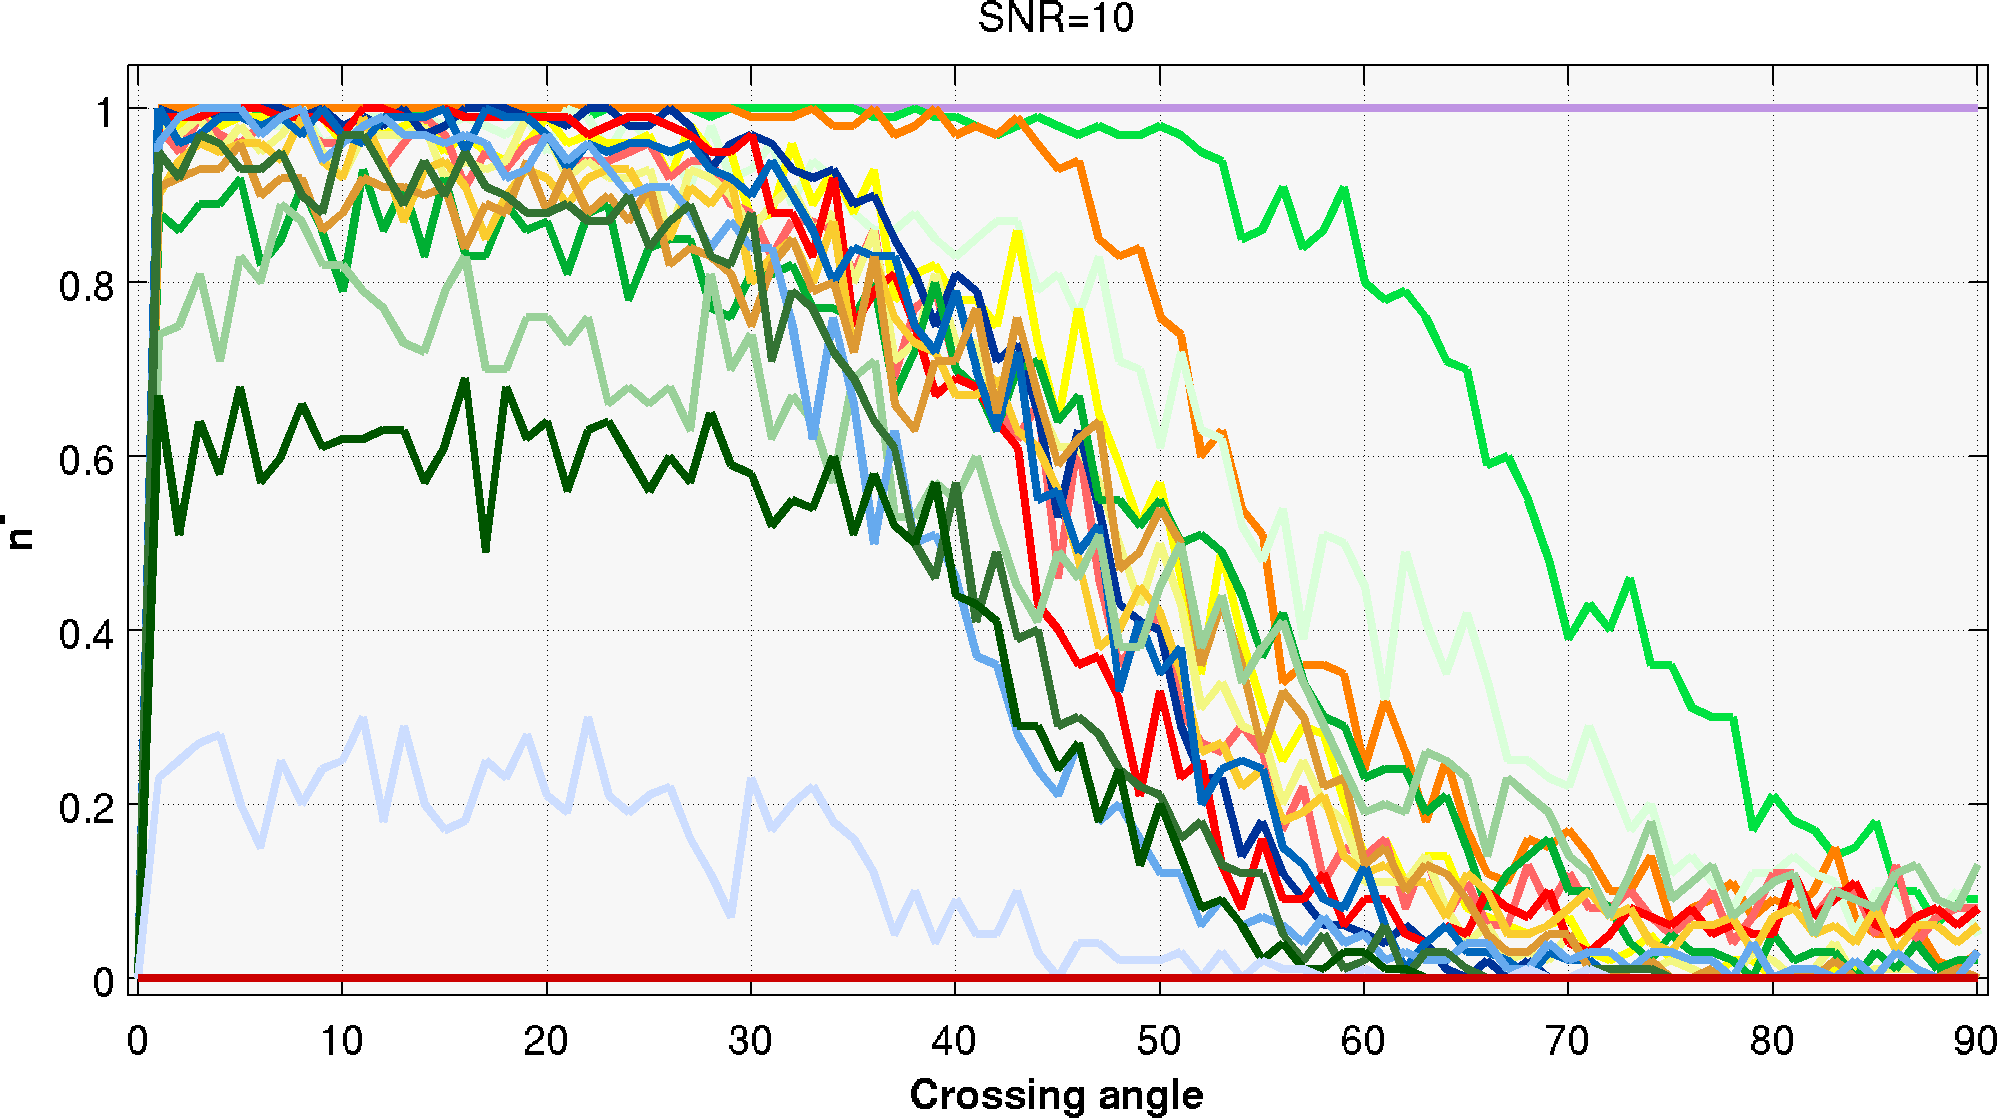
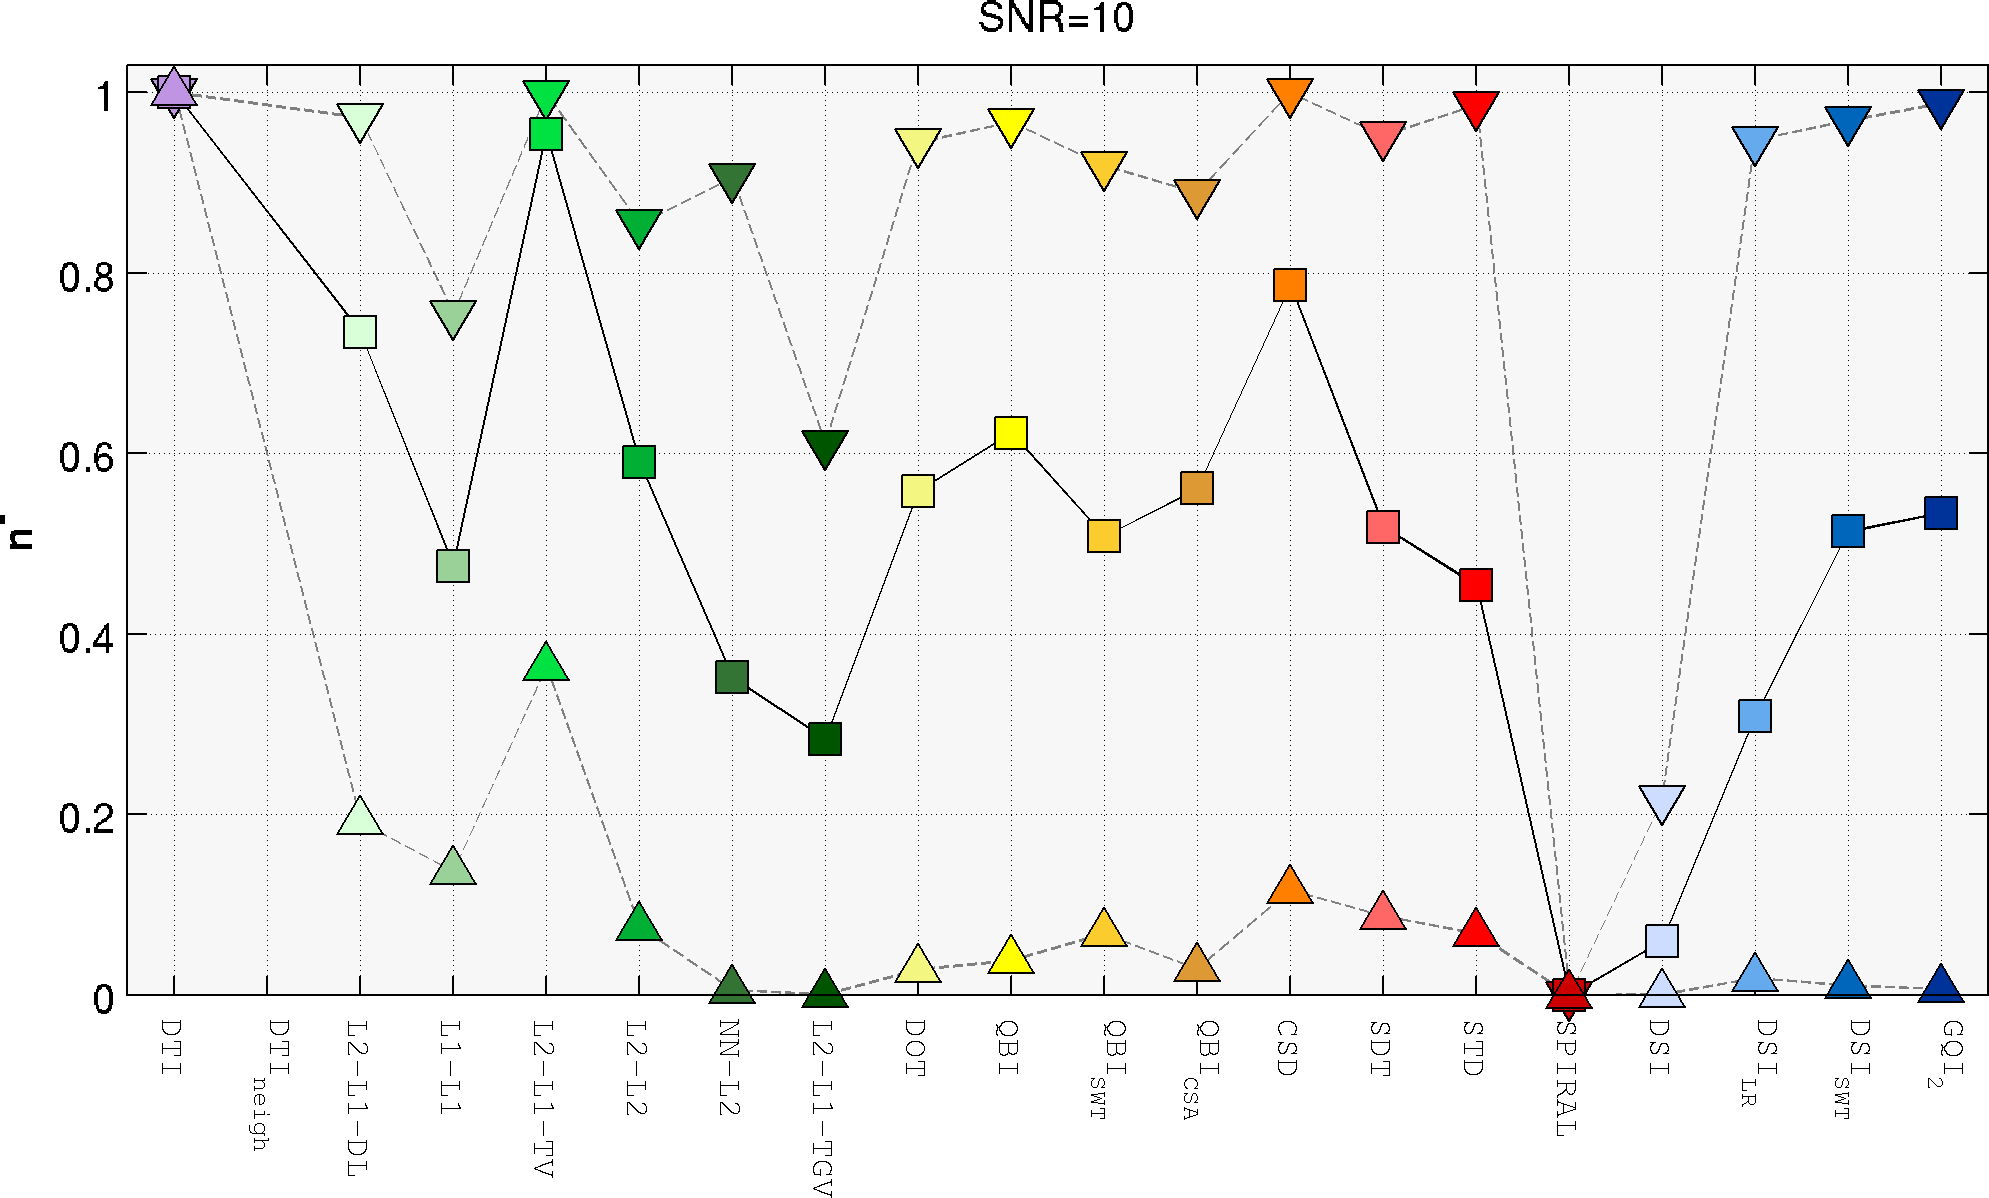
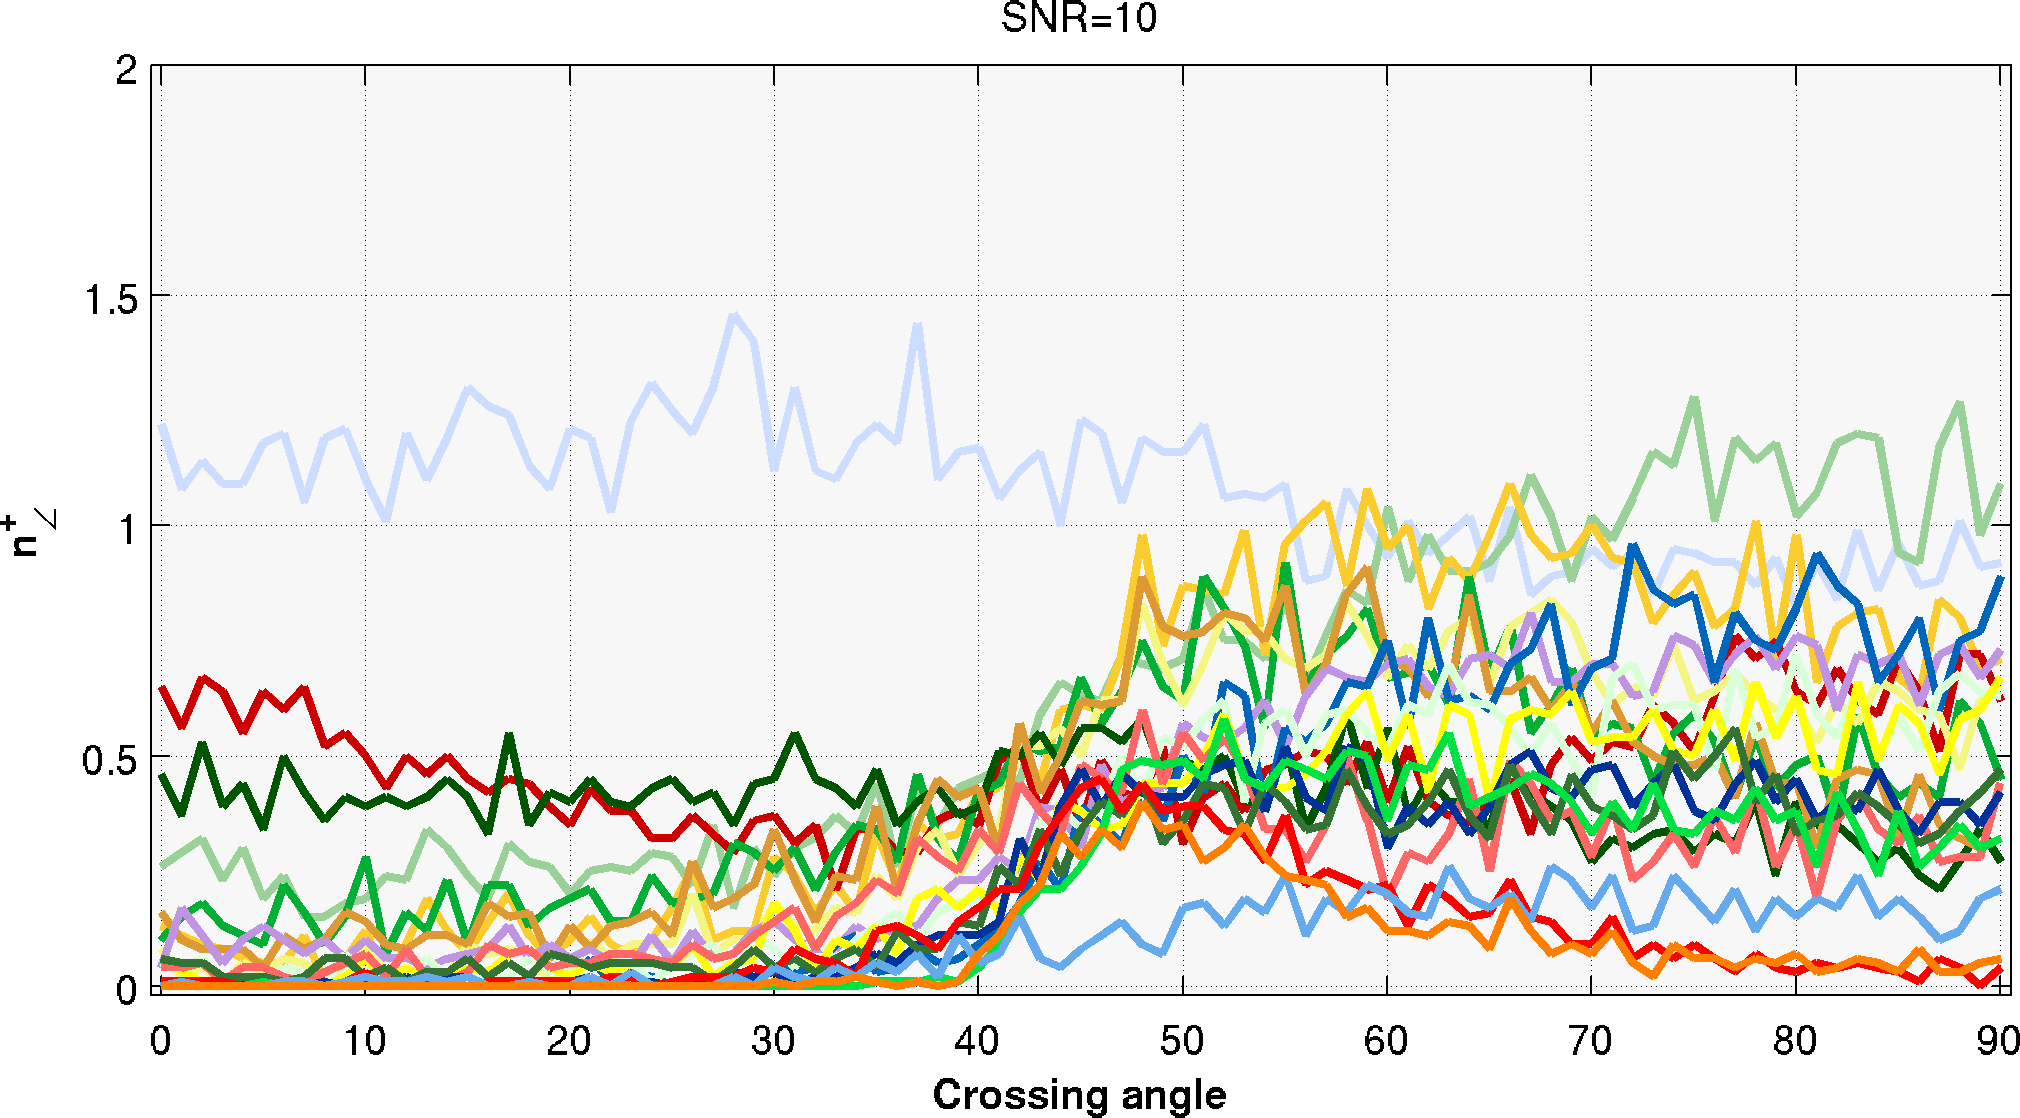
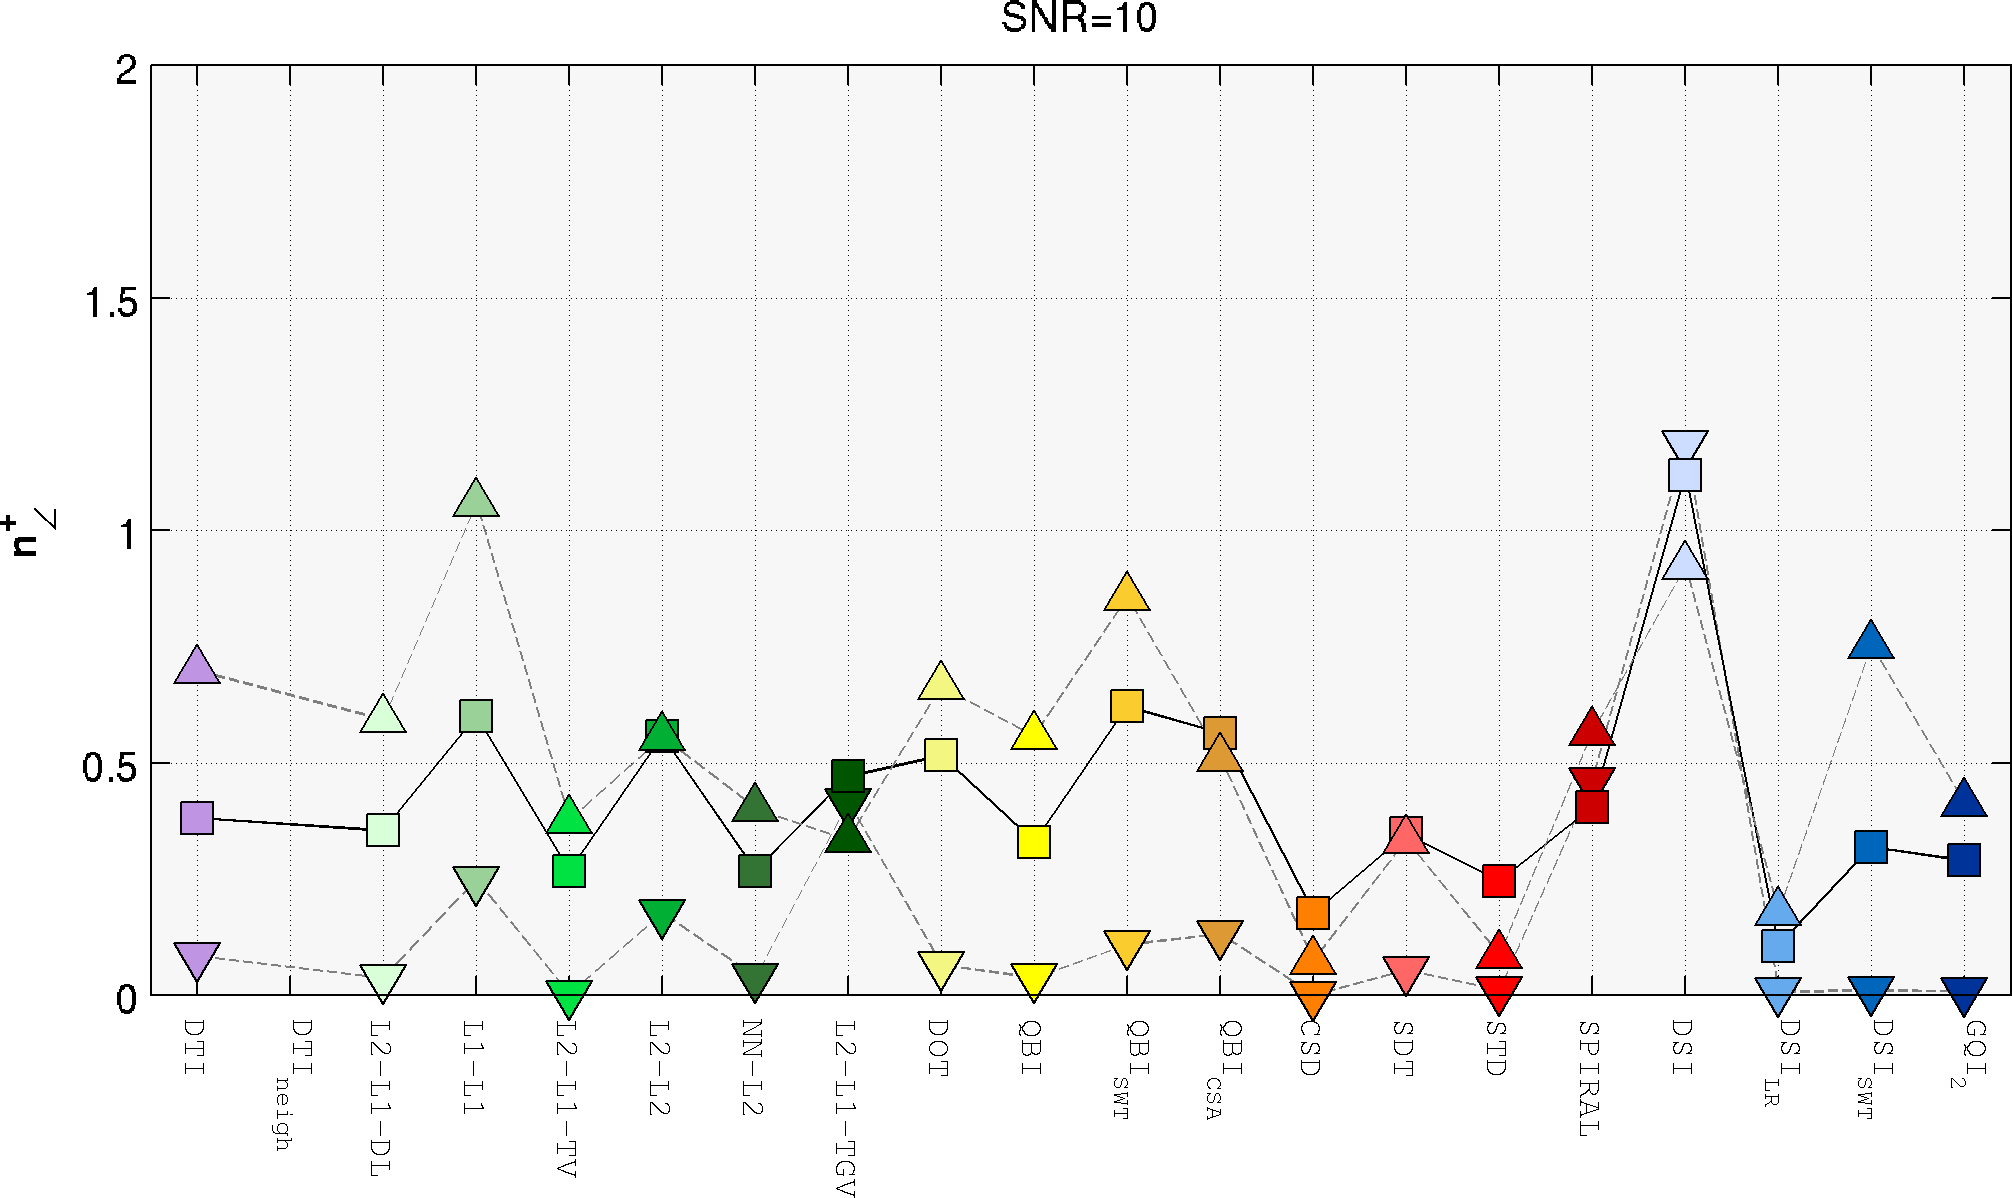
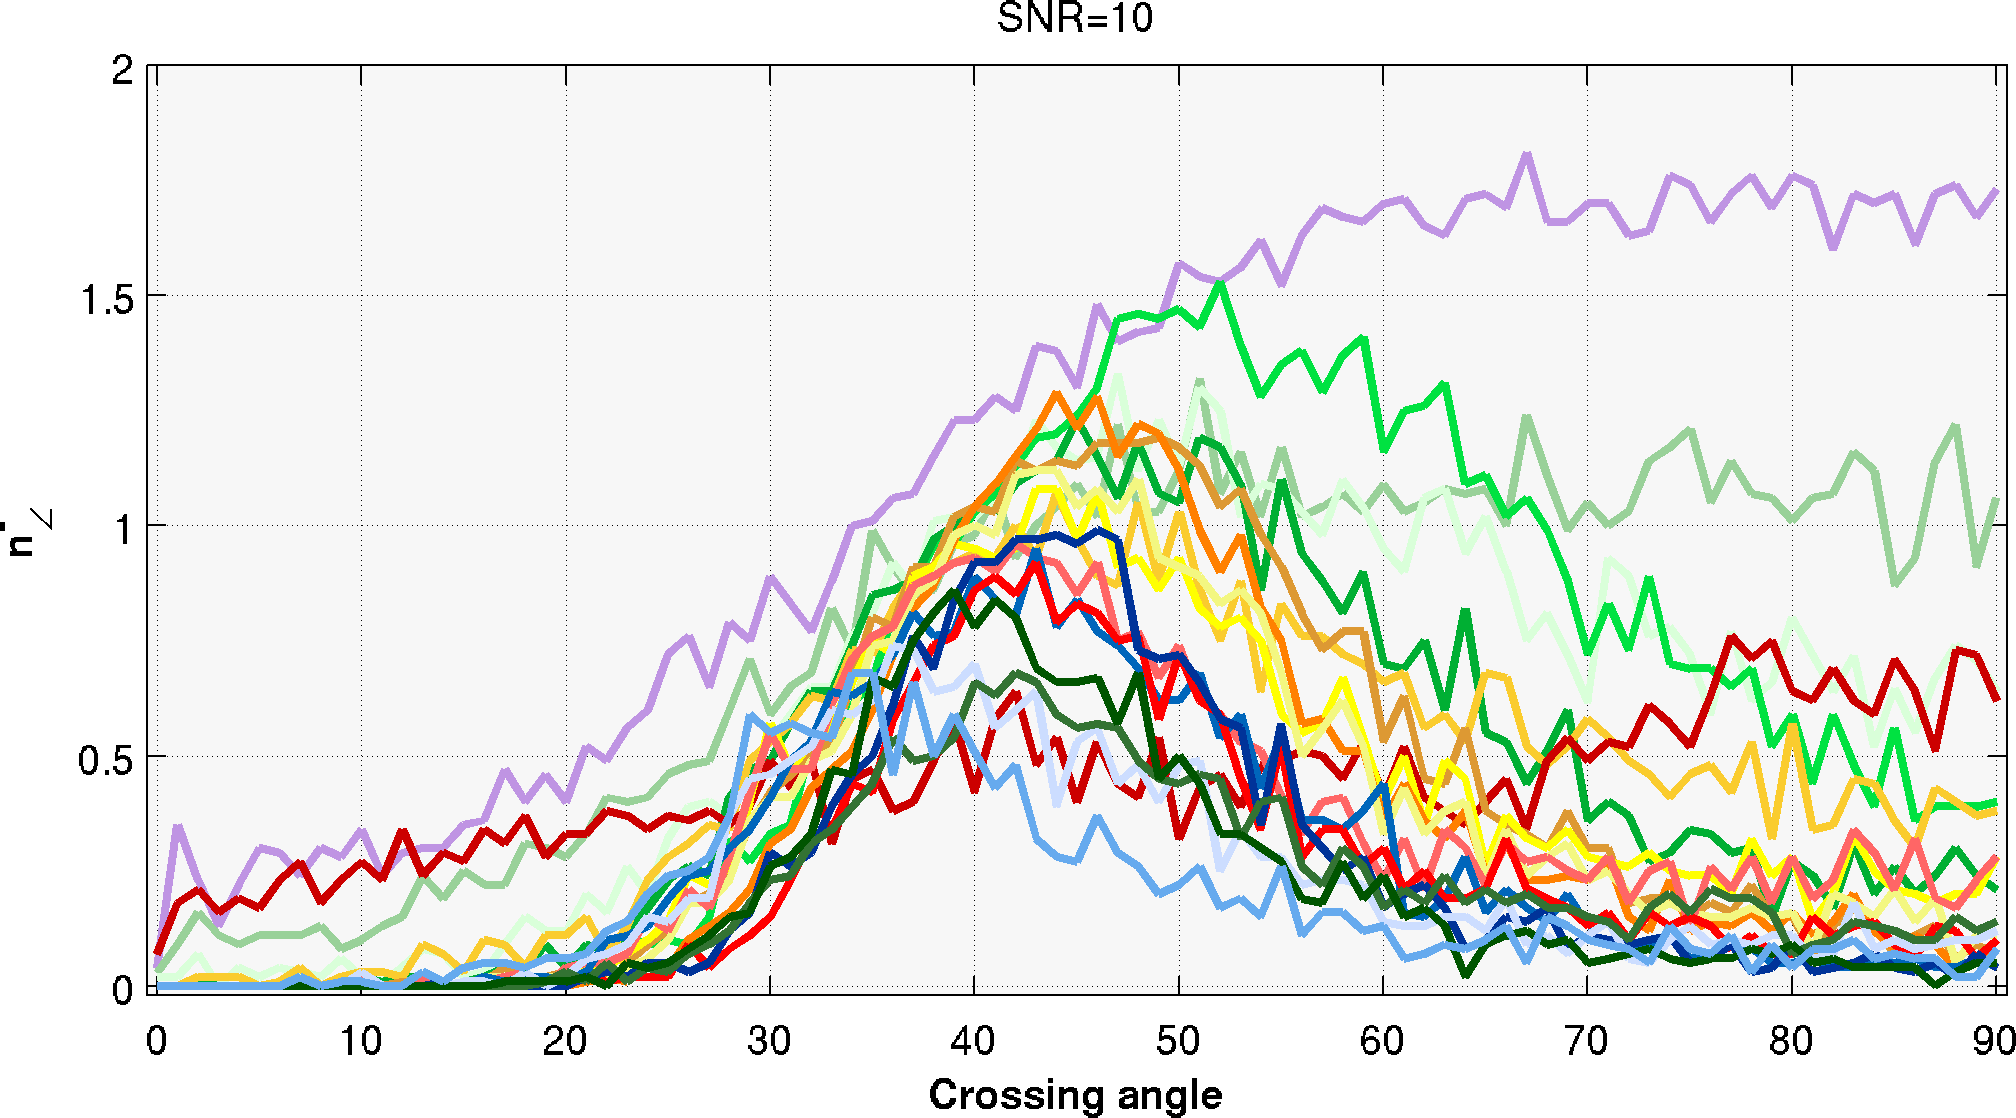
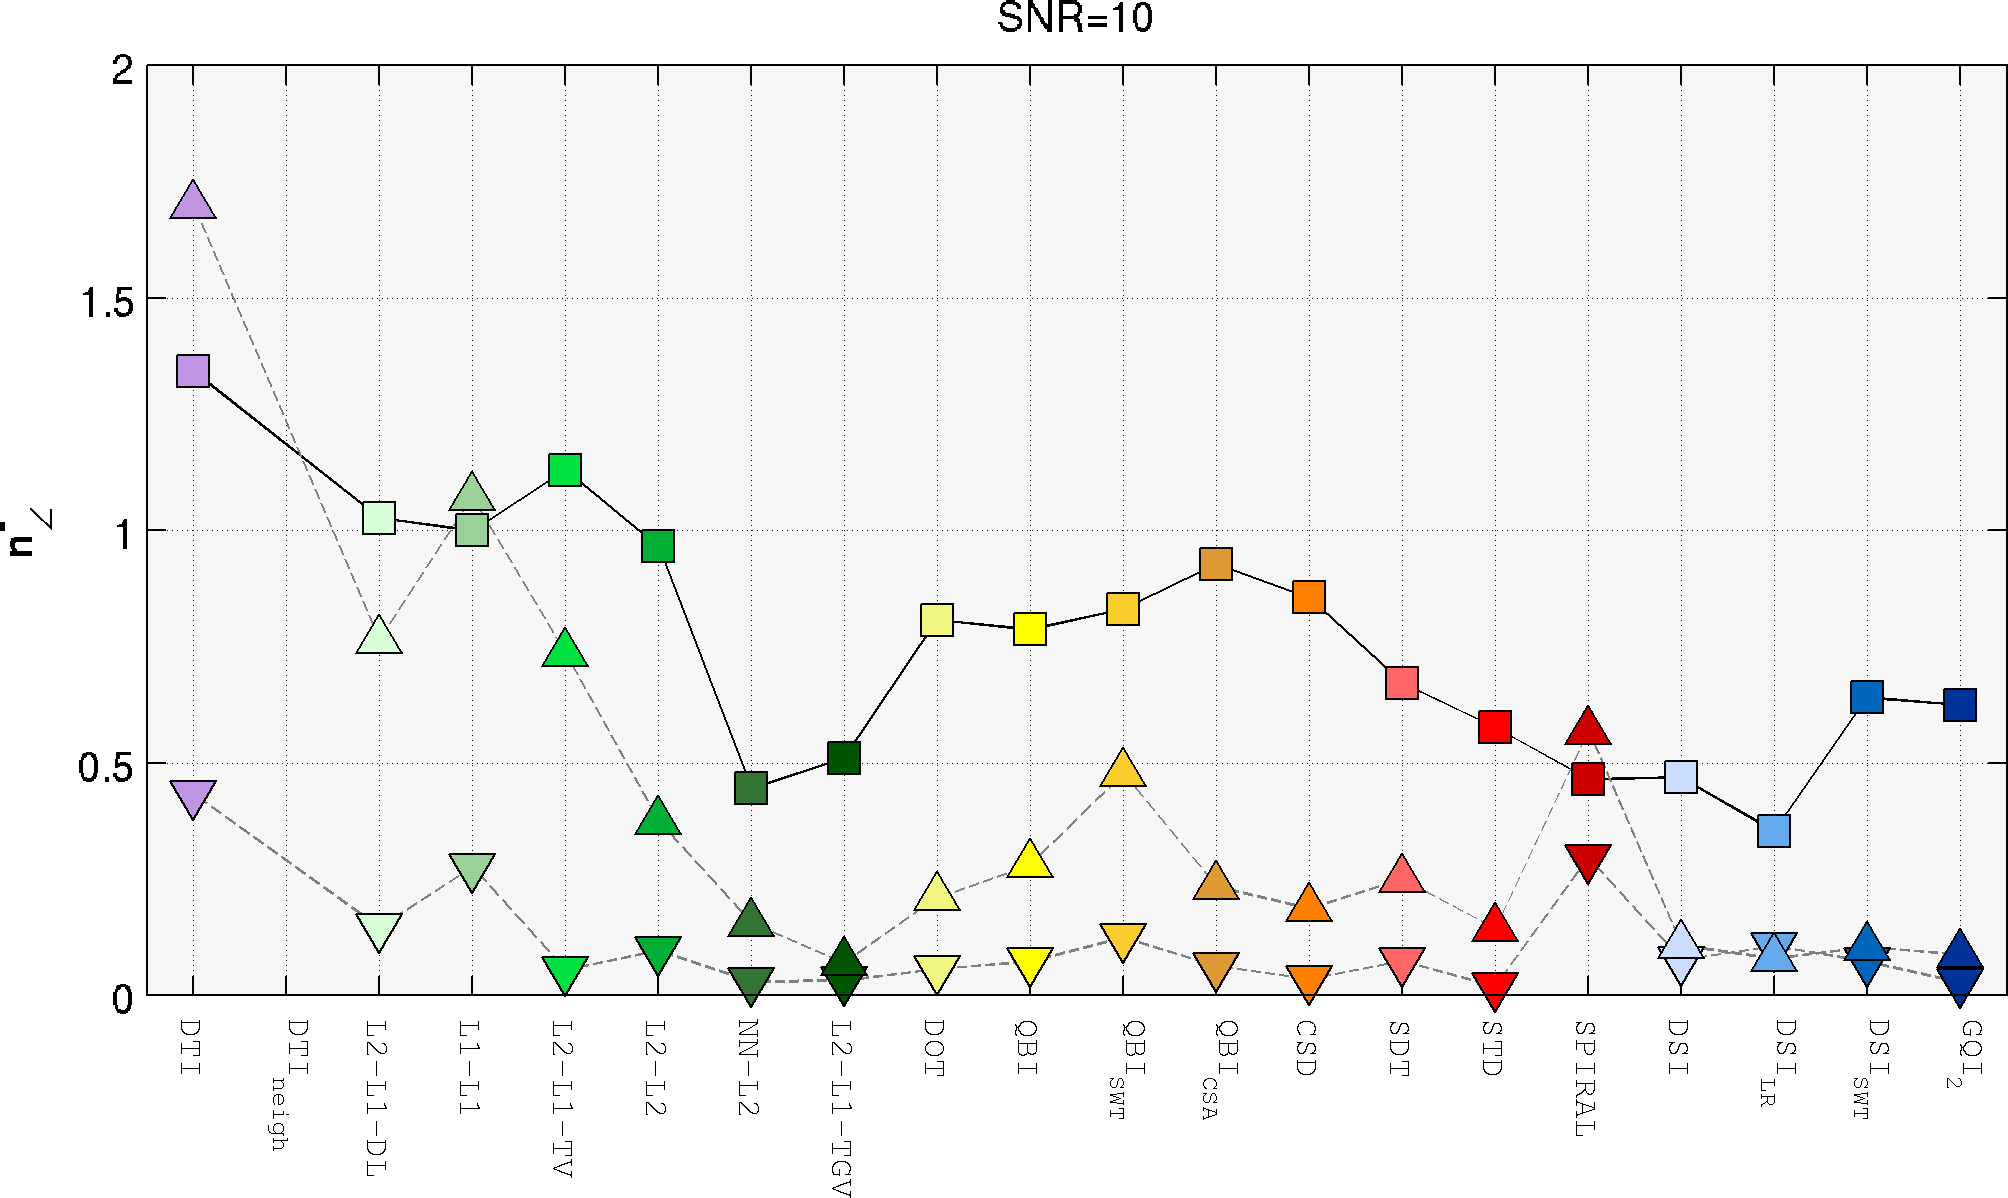
The following plots present the detailed performance of each method with respect to the estimation of the number of fiber populations in a voxel.
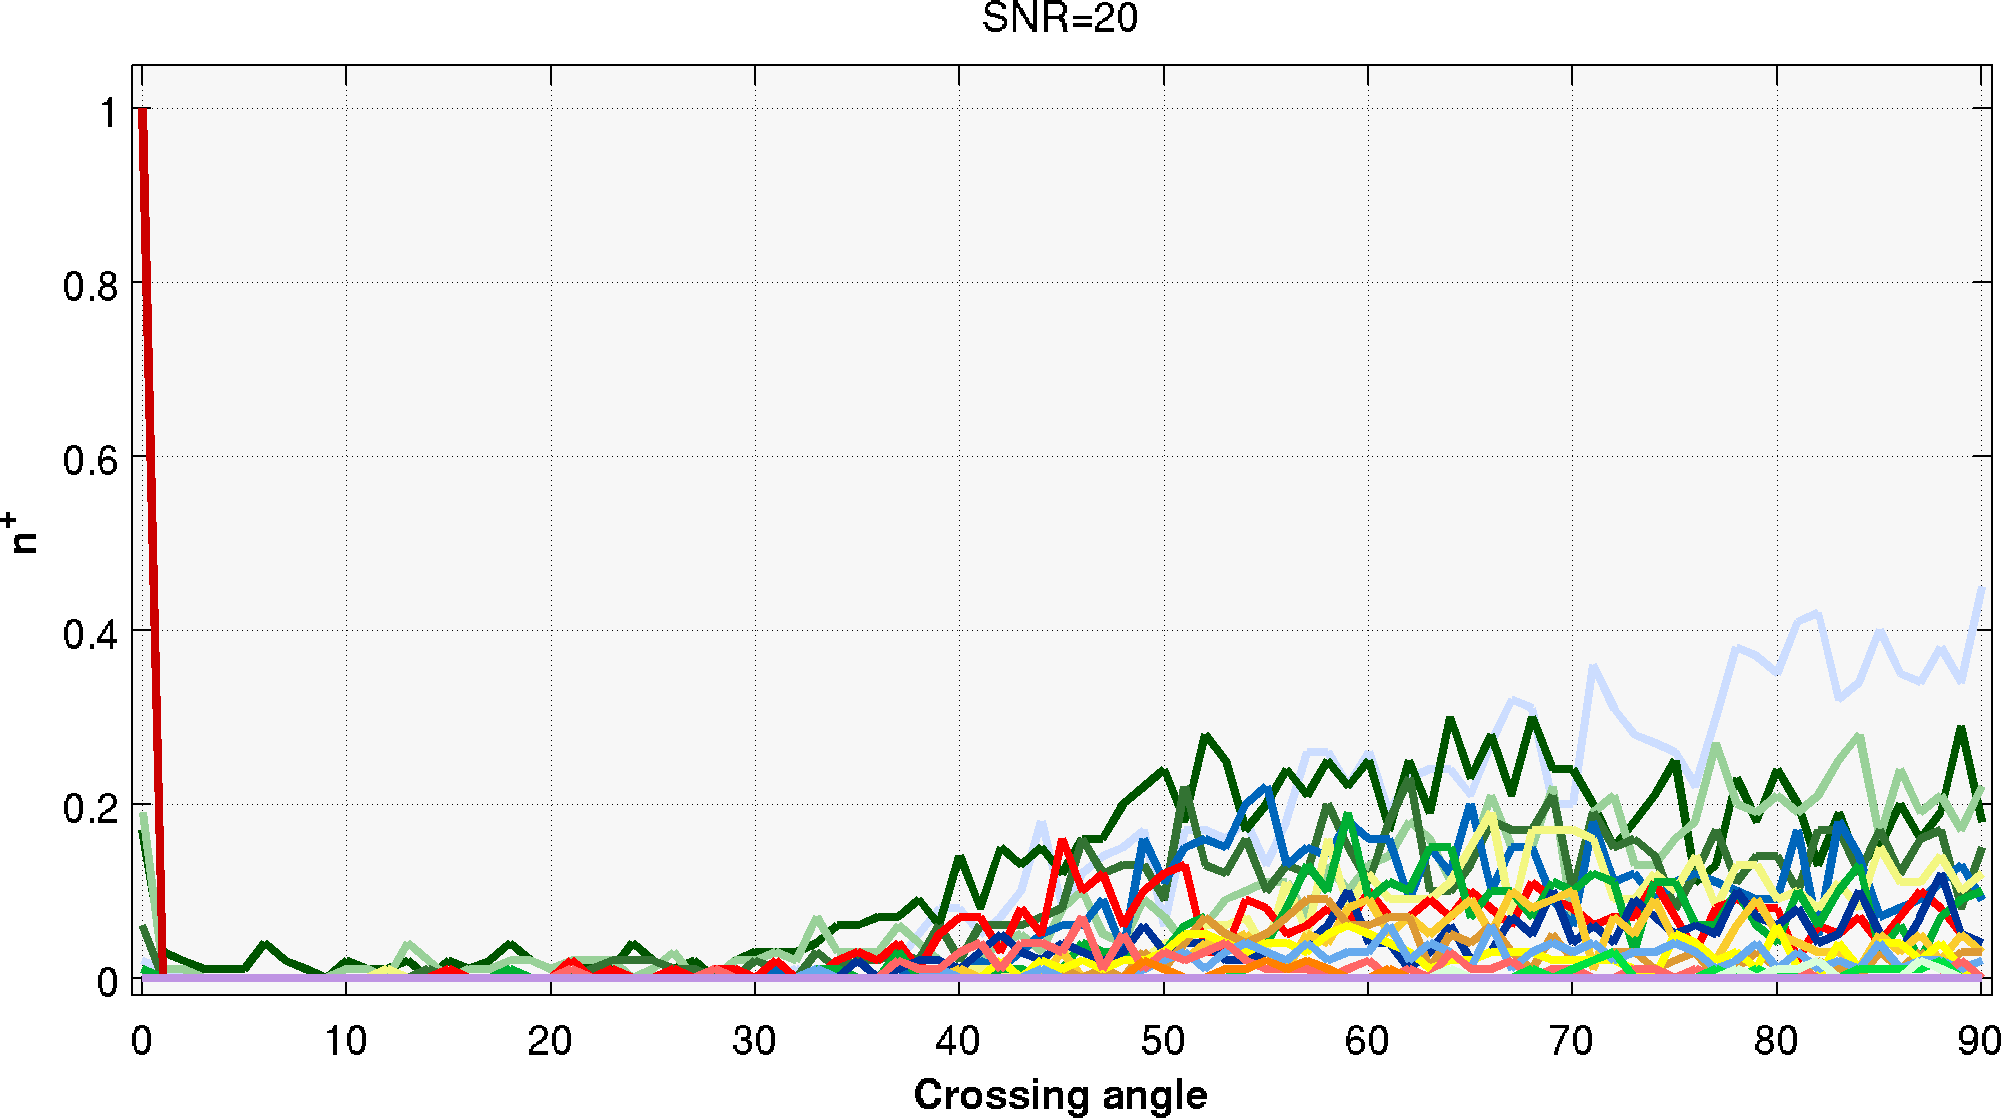
The performances are reported both considering the raw estimated fiber directions, metrics  ,
,  ,
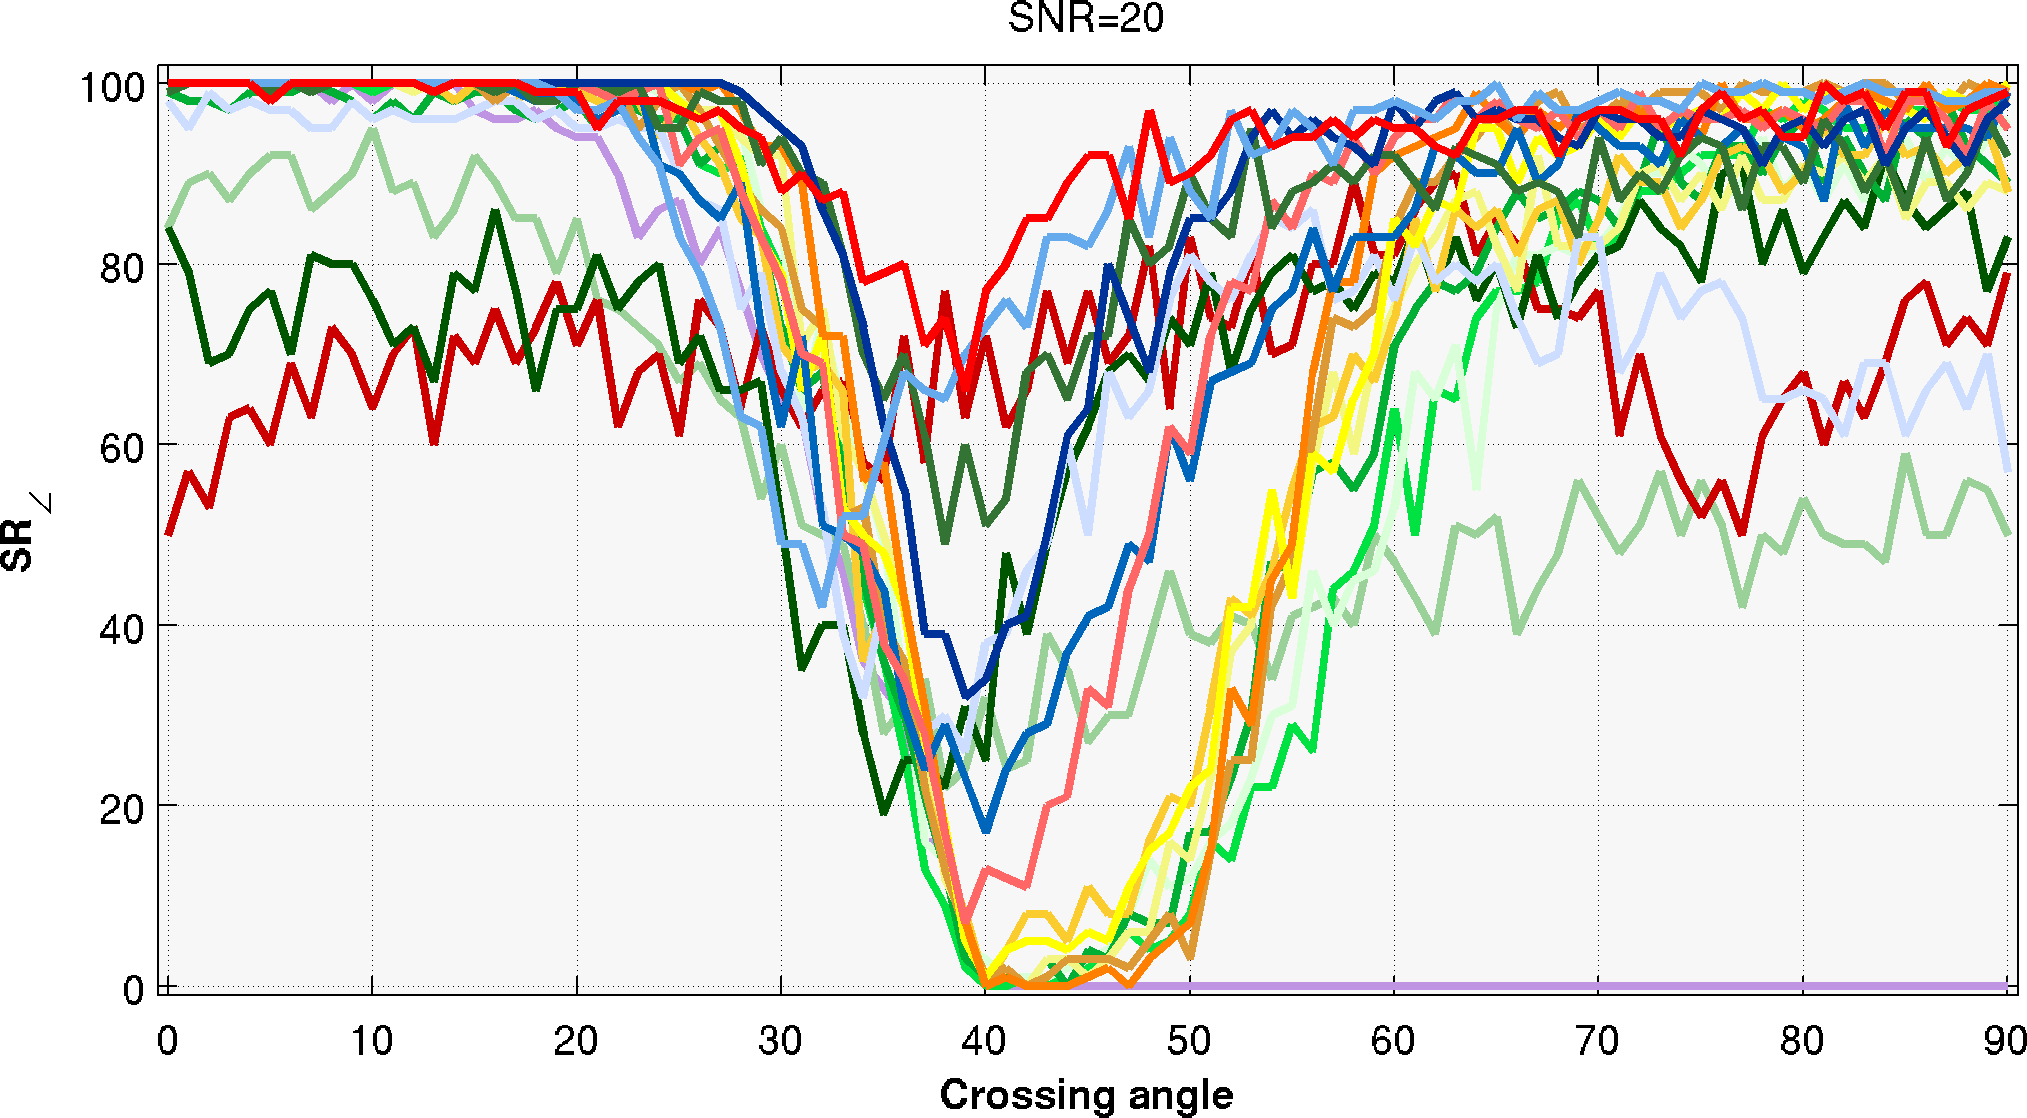
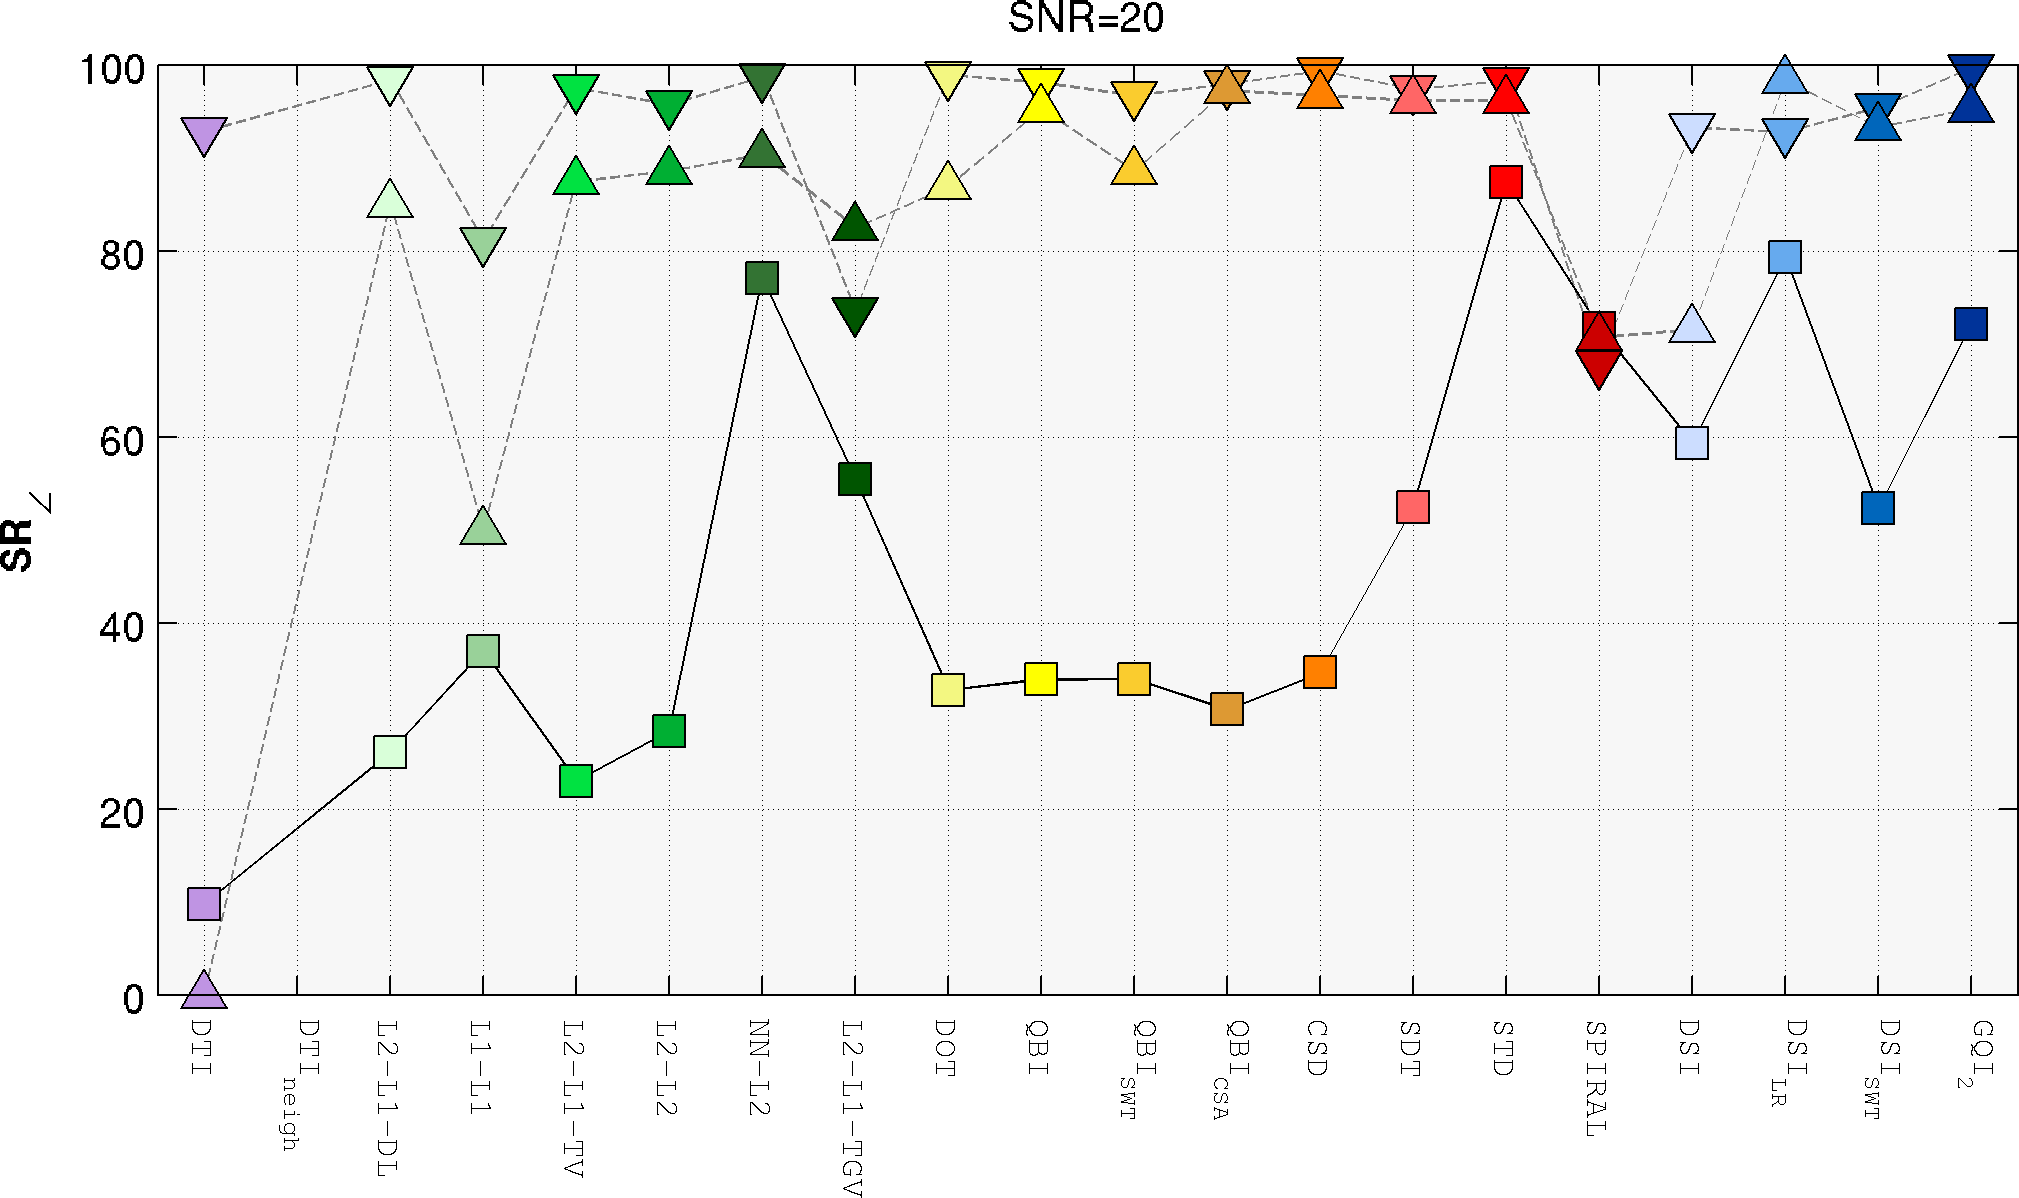
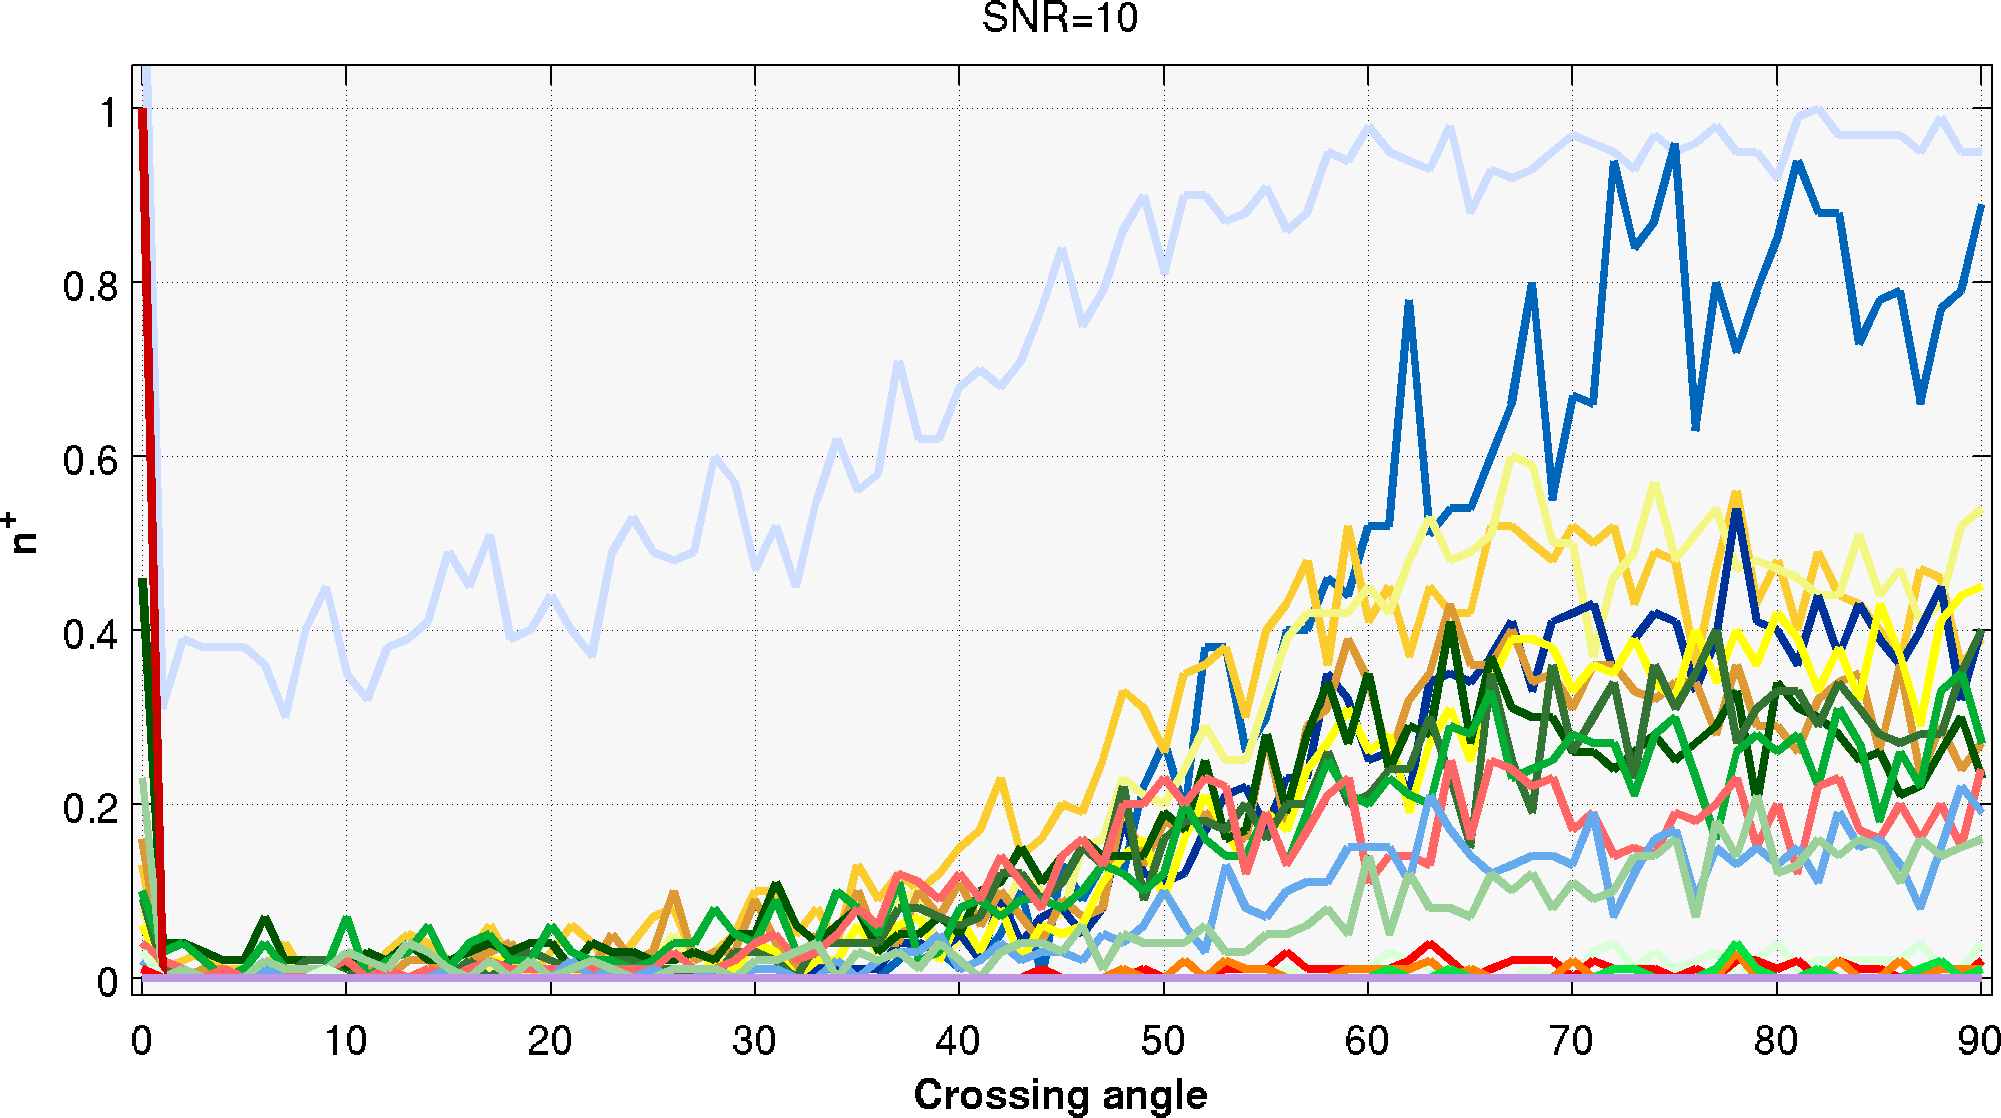
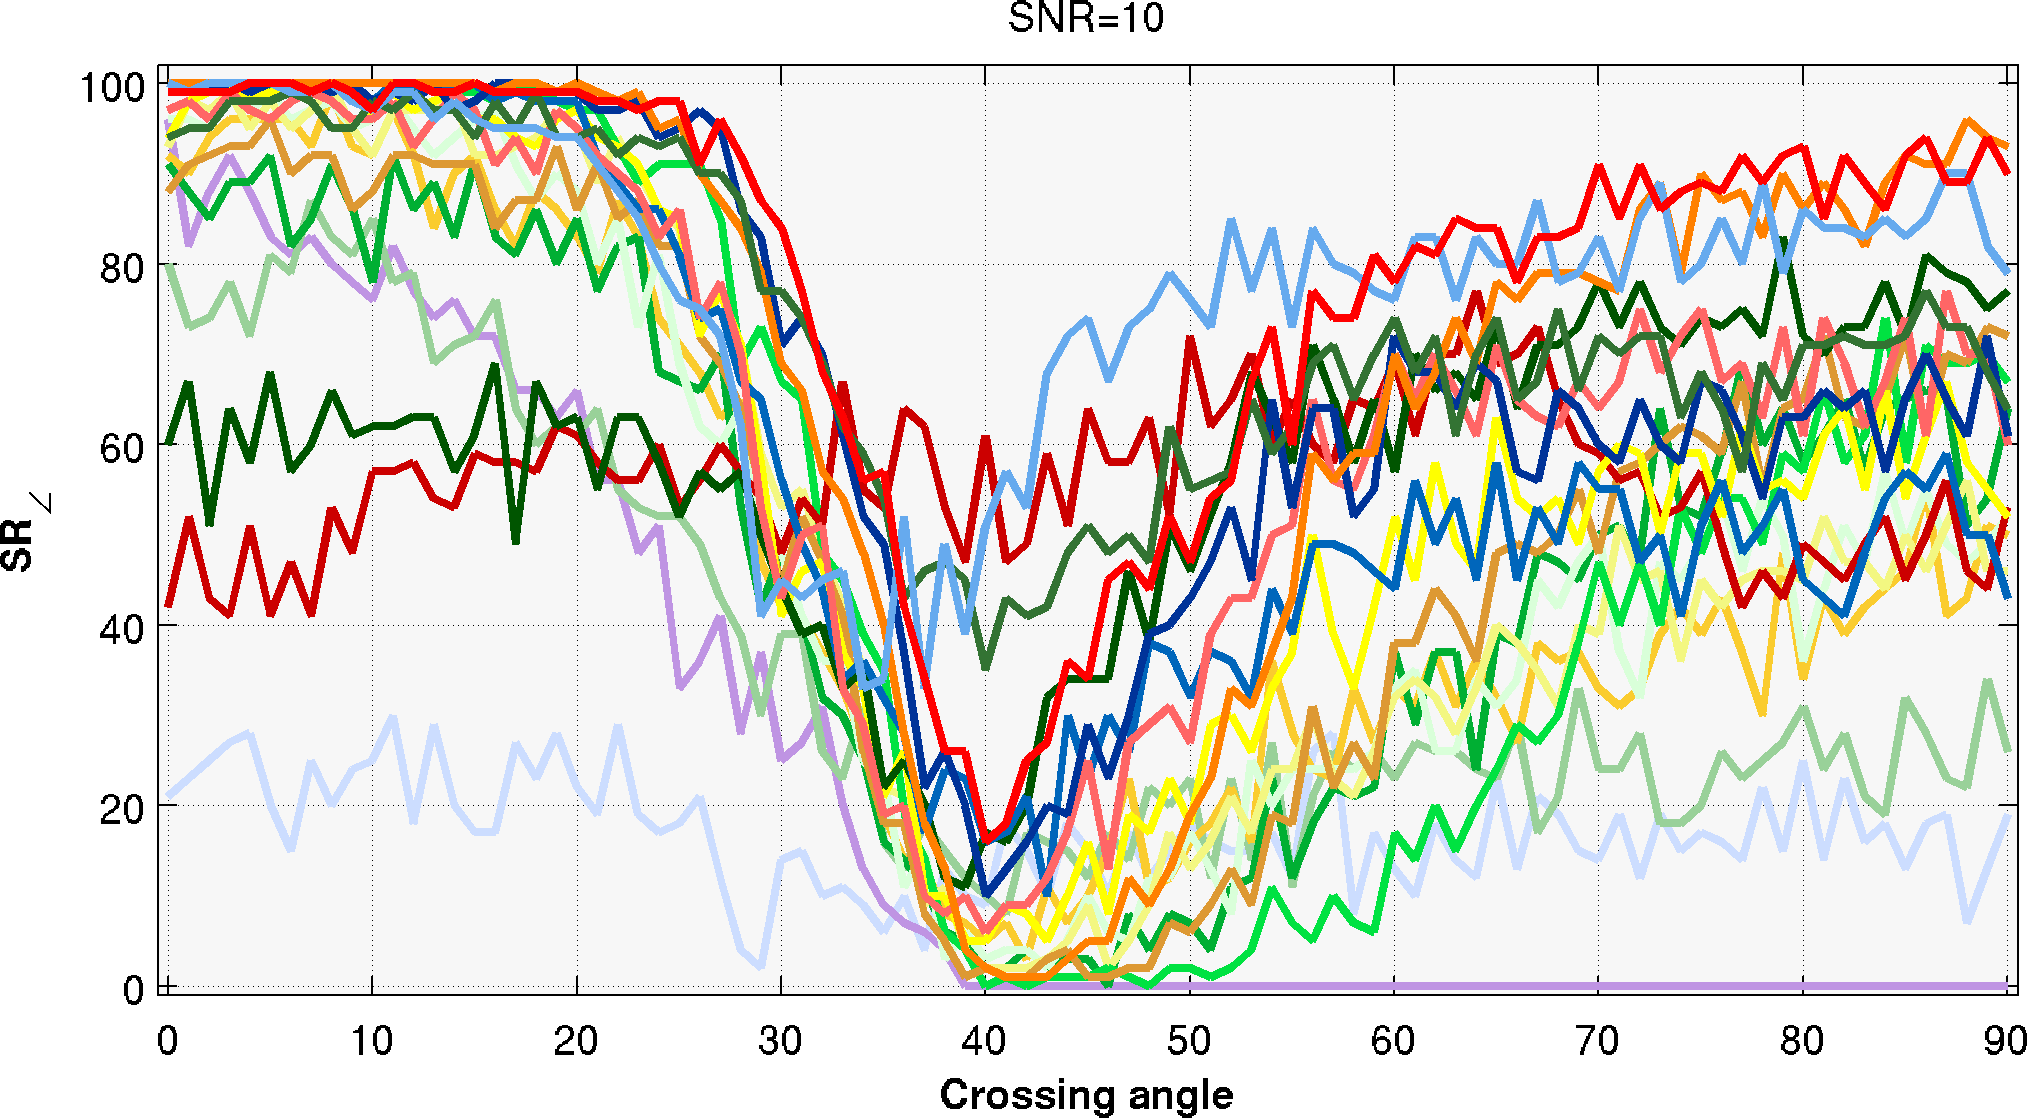
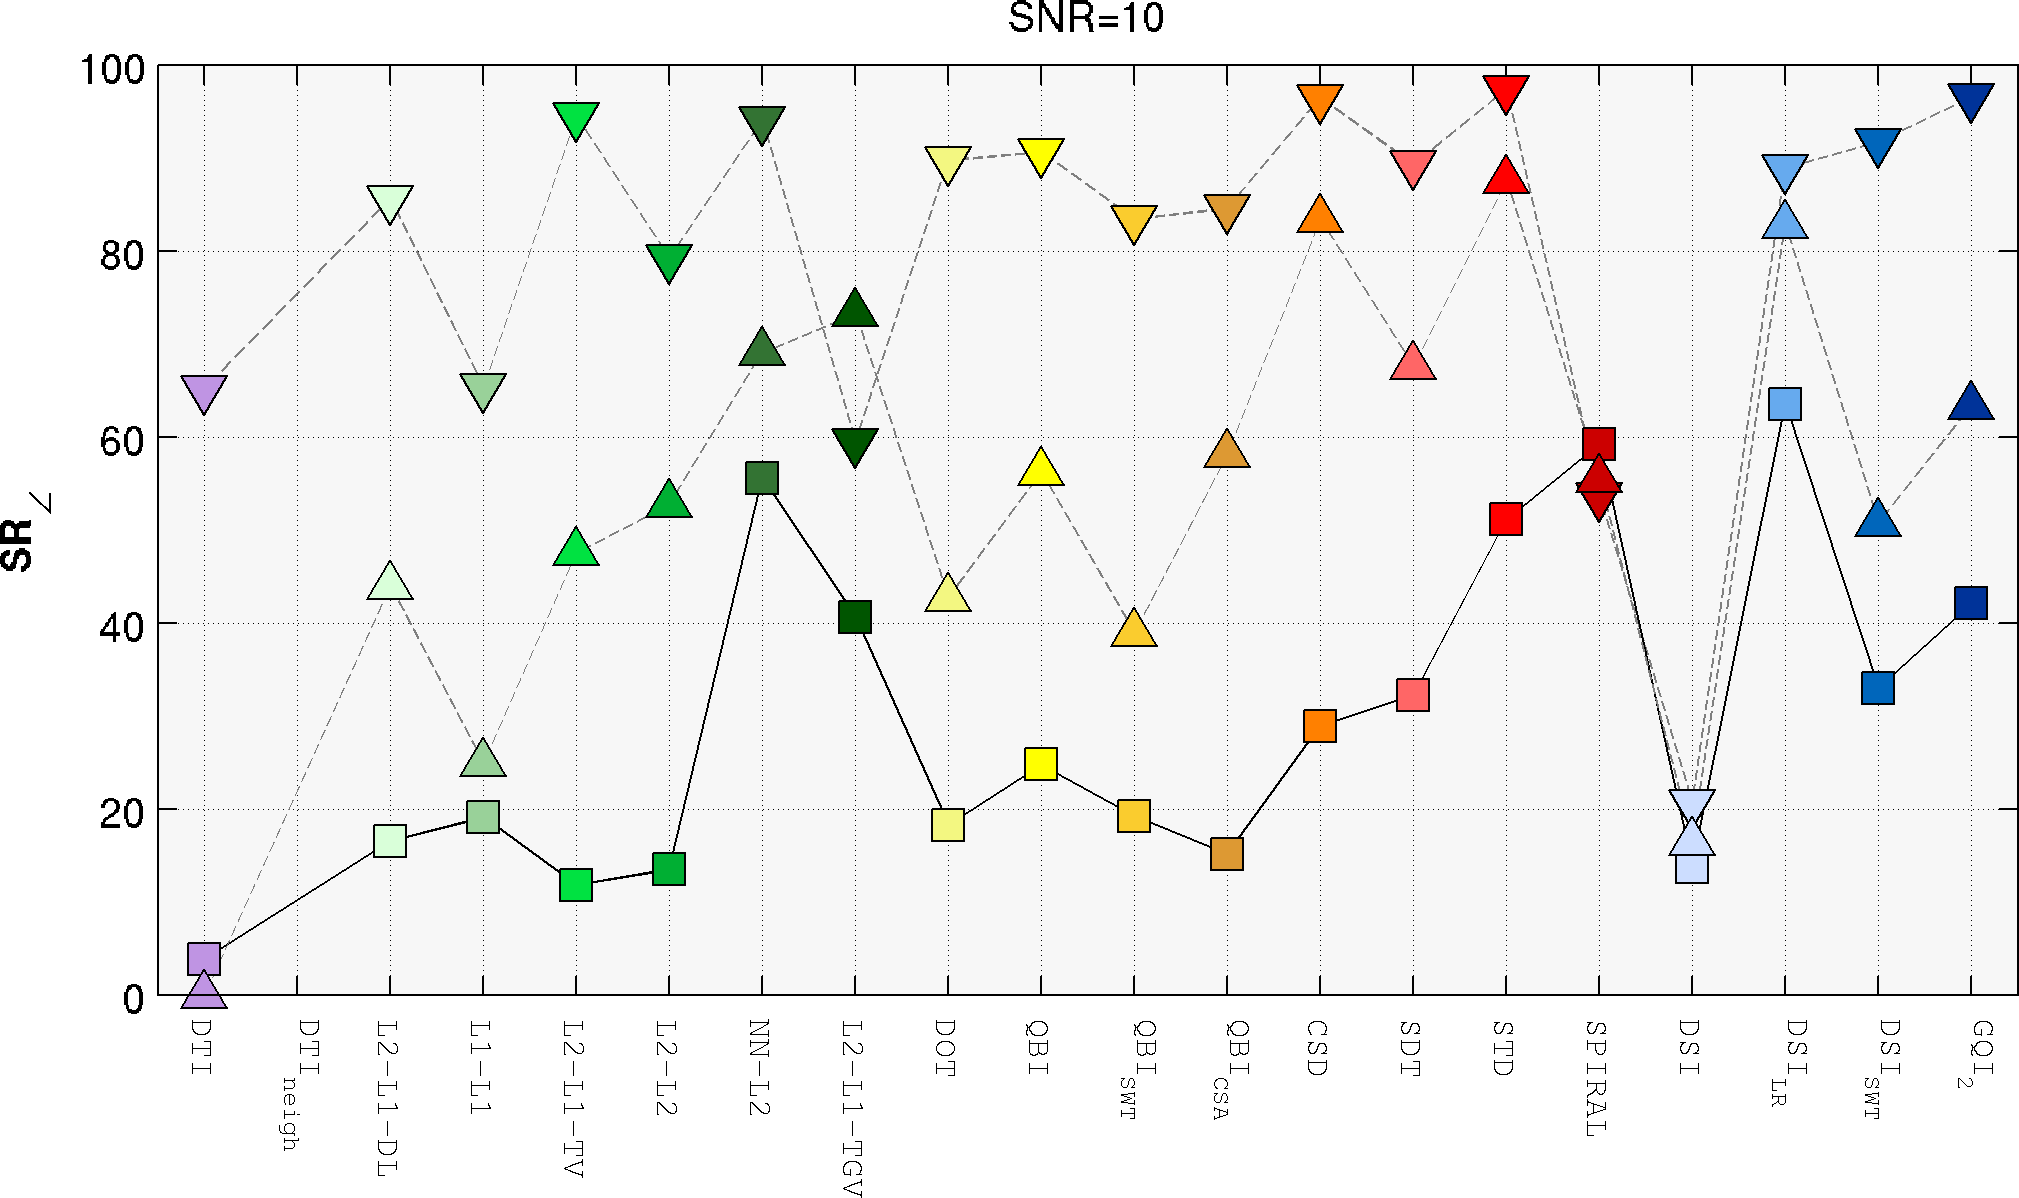
,  , and also using a tolerancer cone, metrics
  ,
,  ,
,  .
.
The average scores are plotted as a function of the crossing angle, where the angle between the two fiber populations was increased from  to
to  .
.
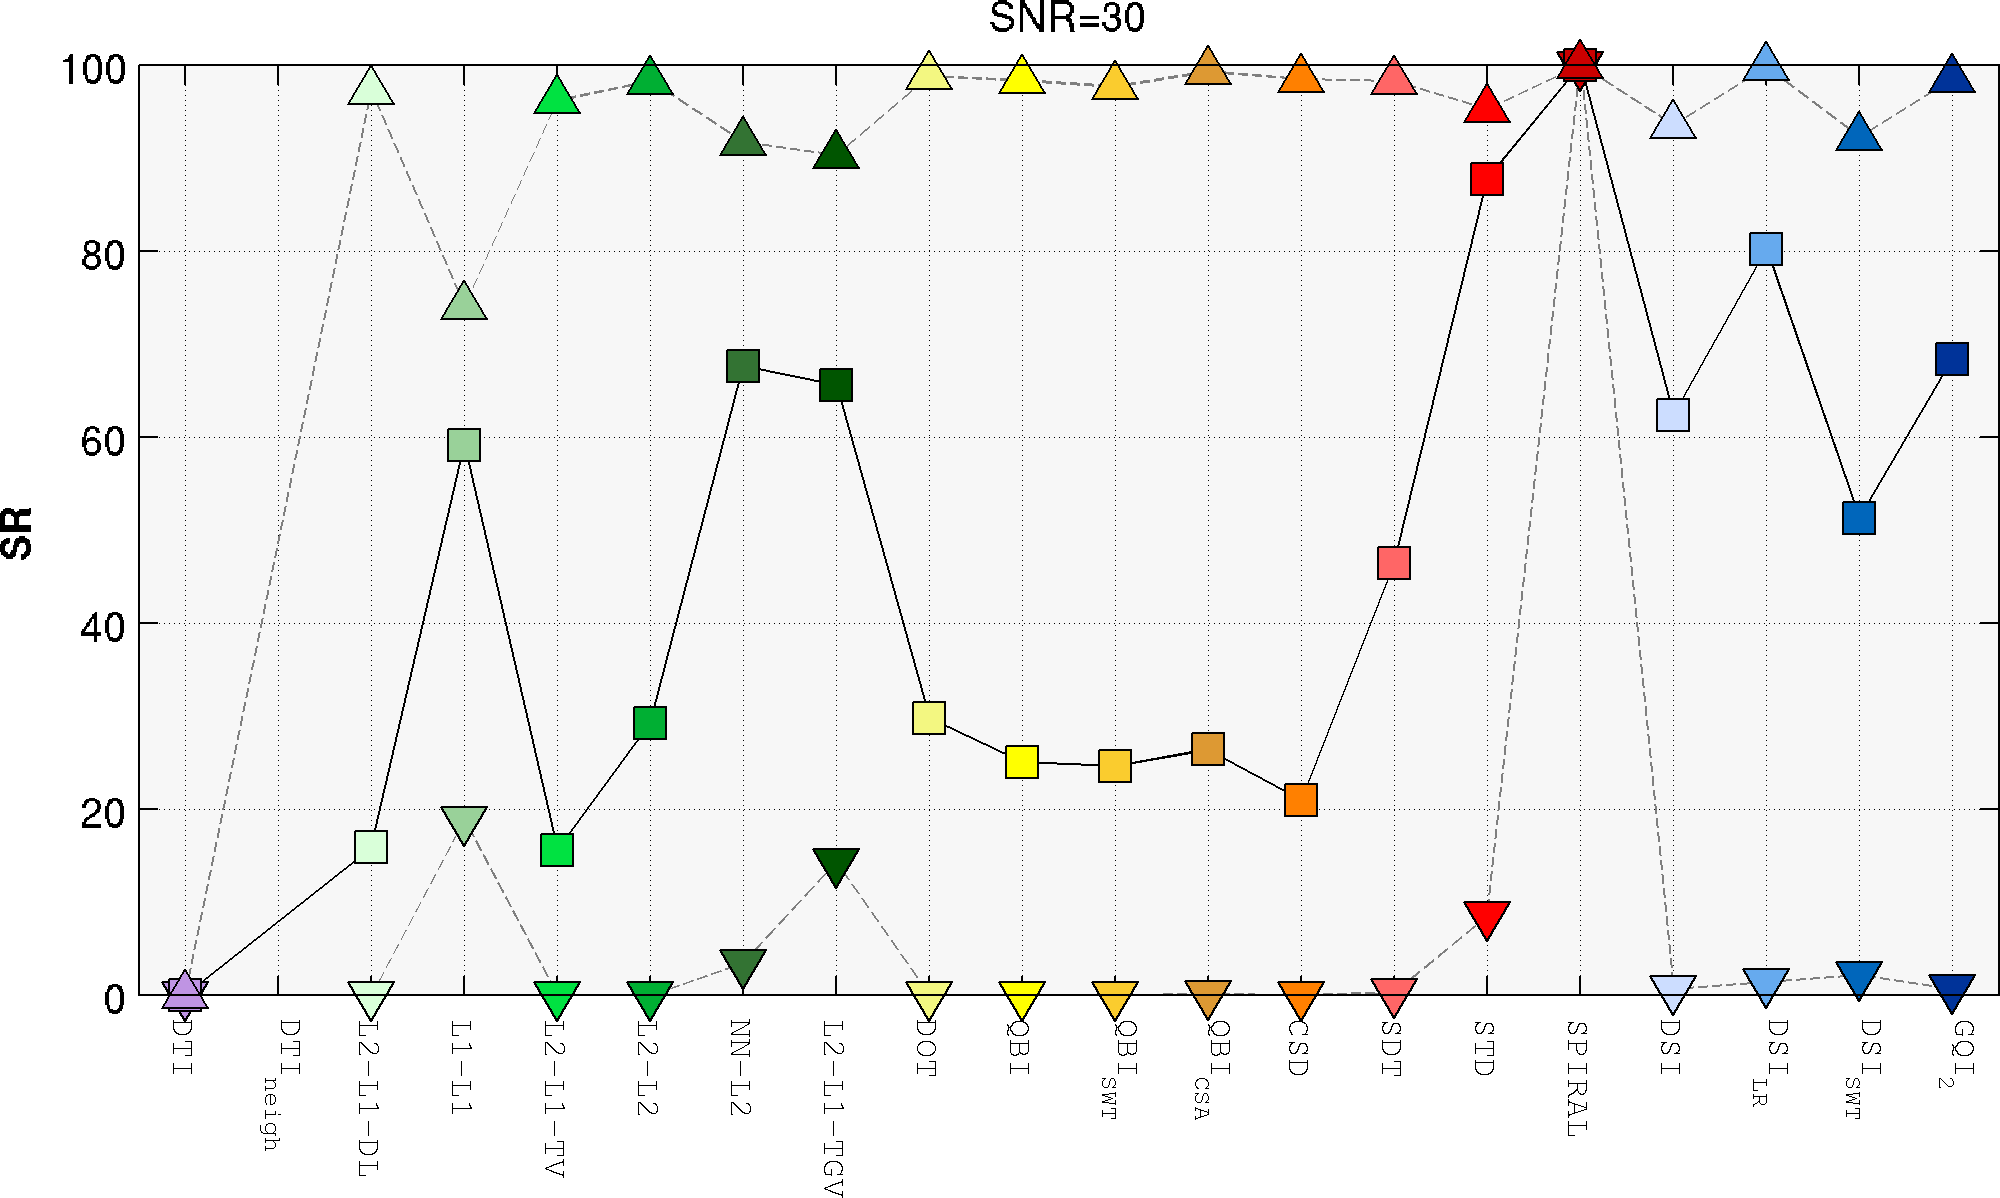
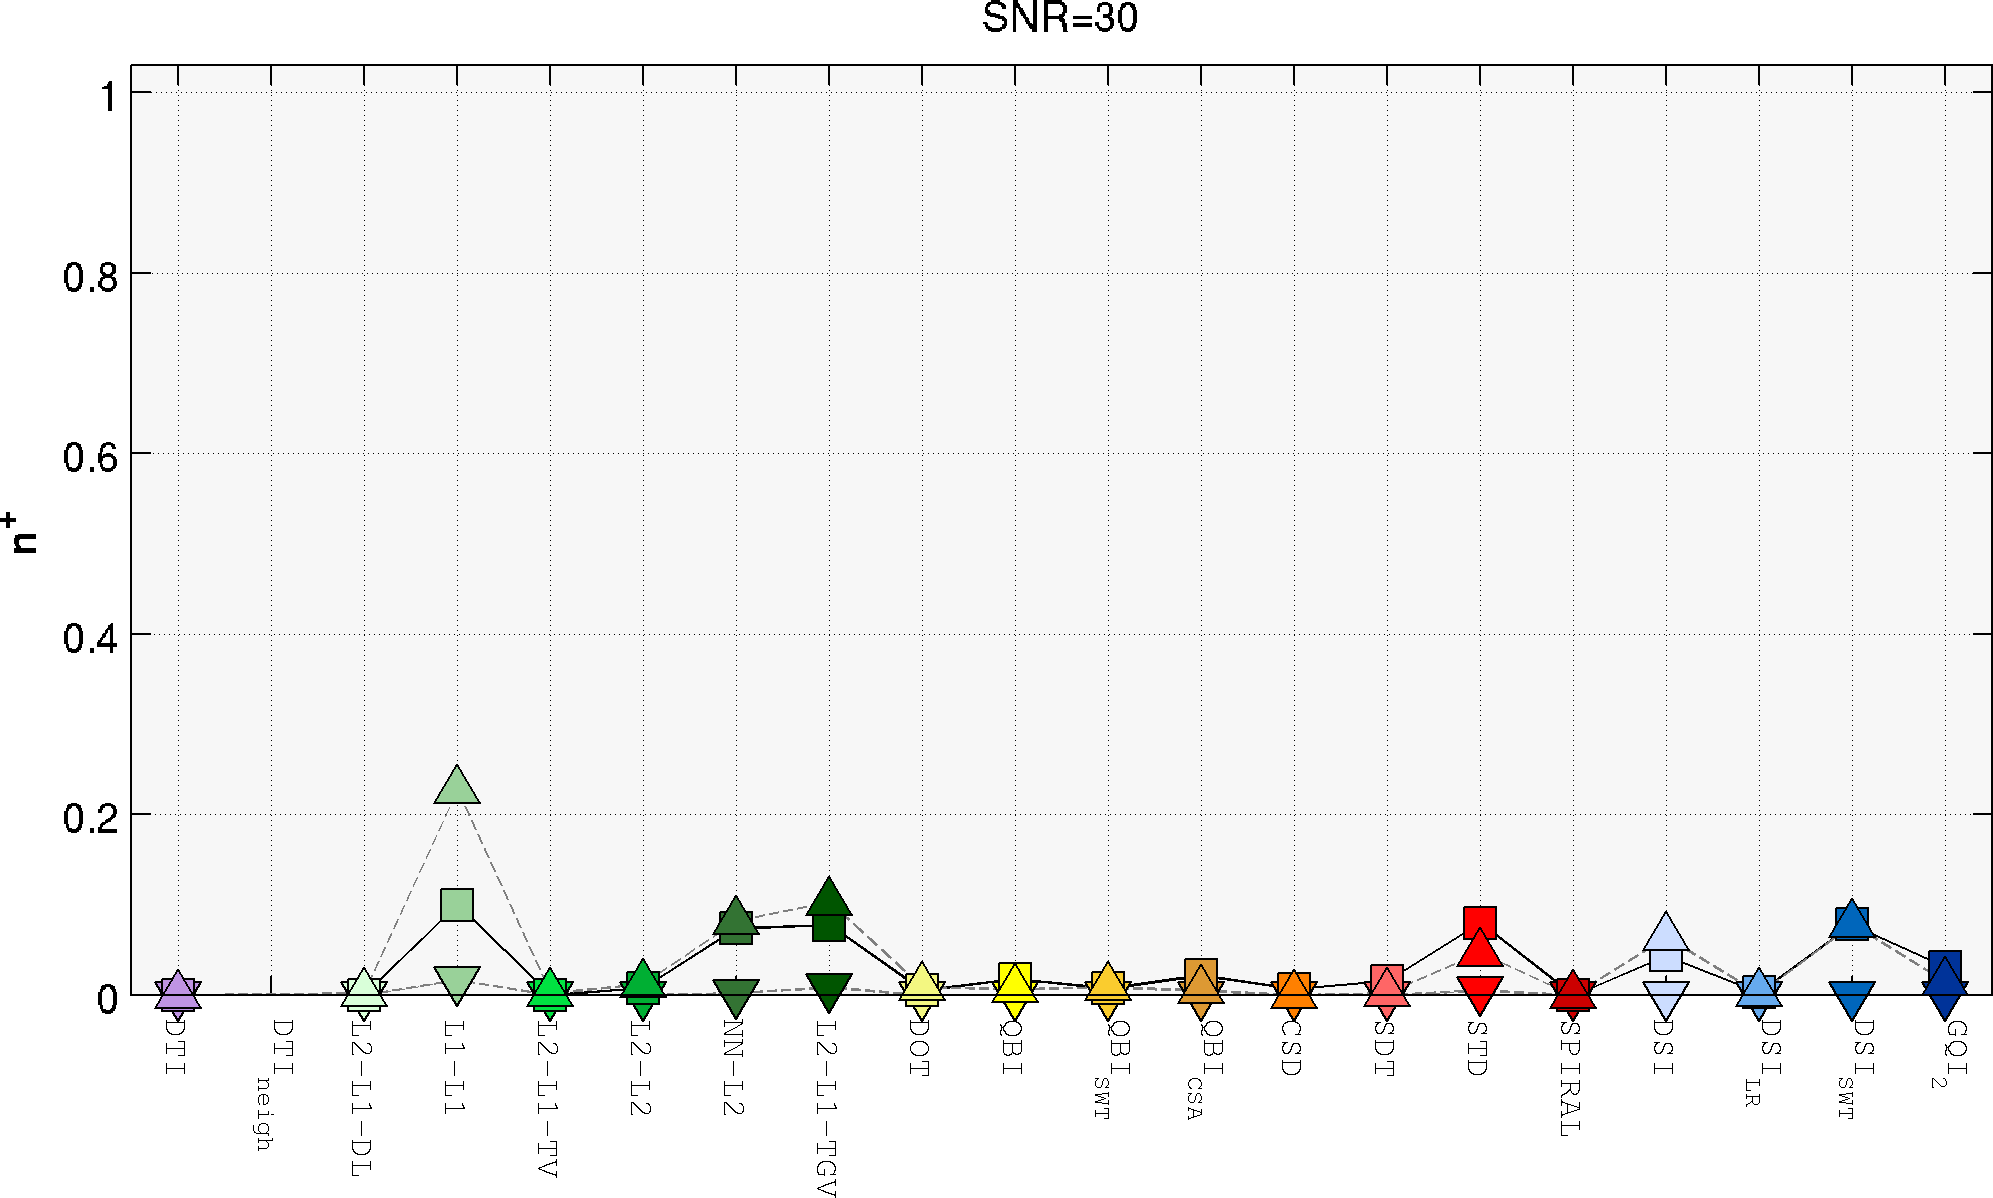
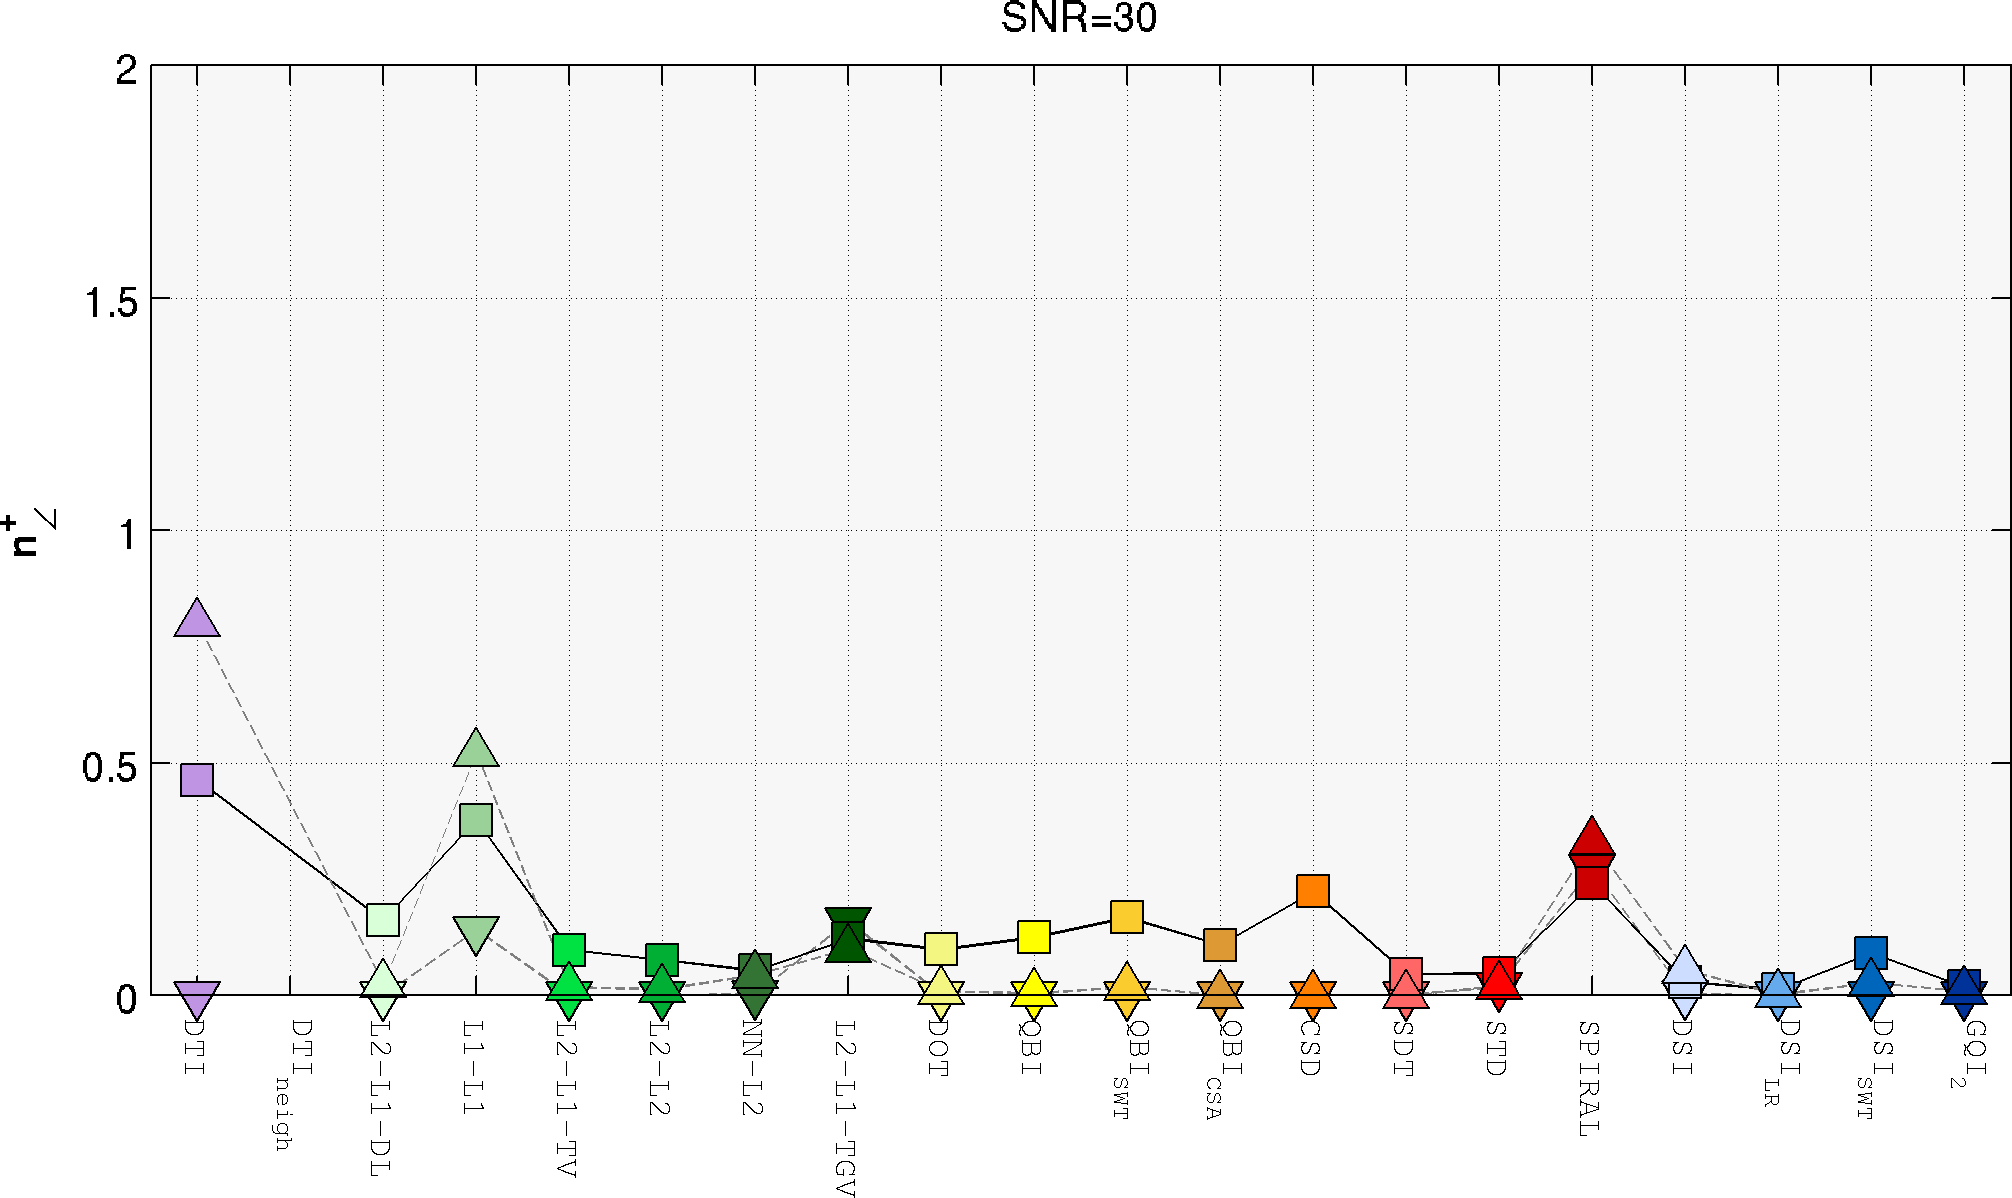
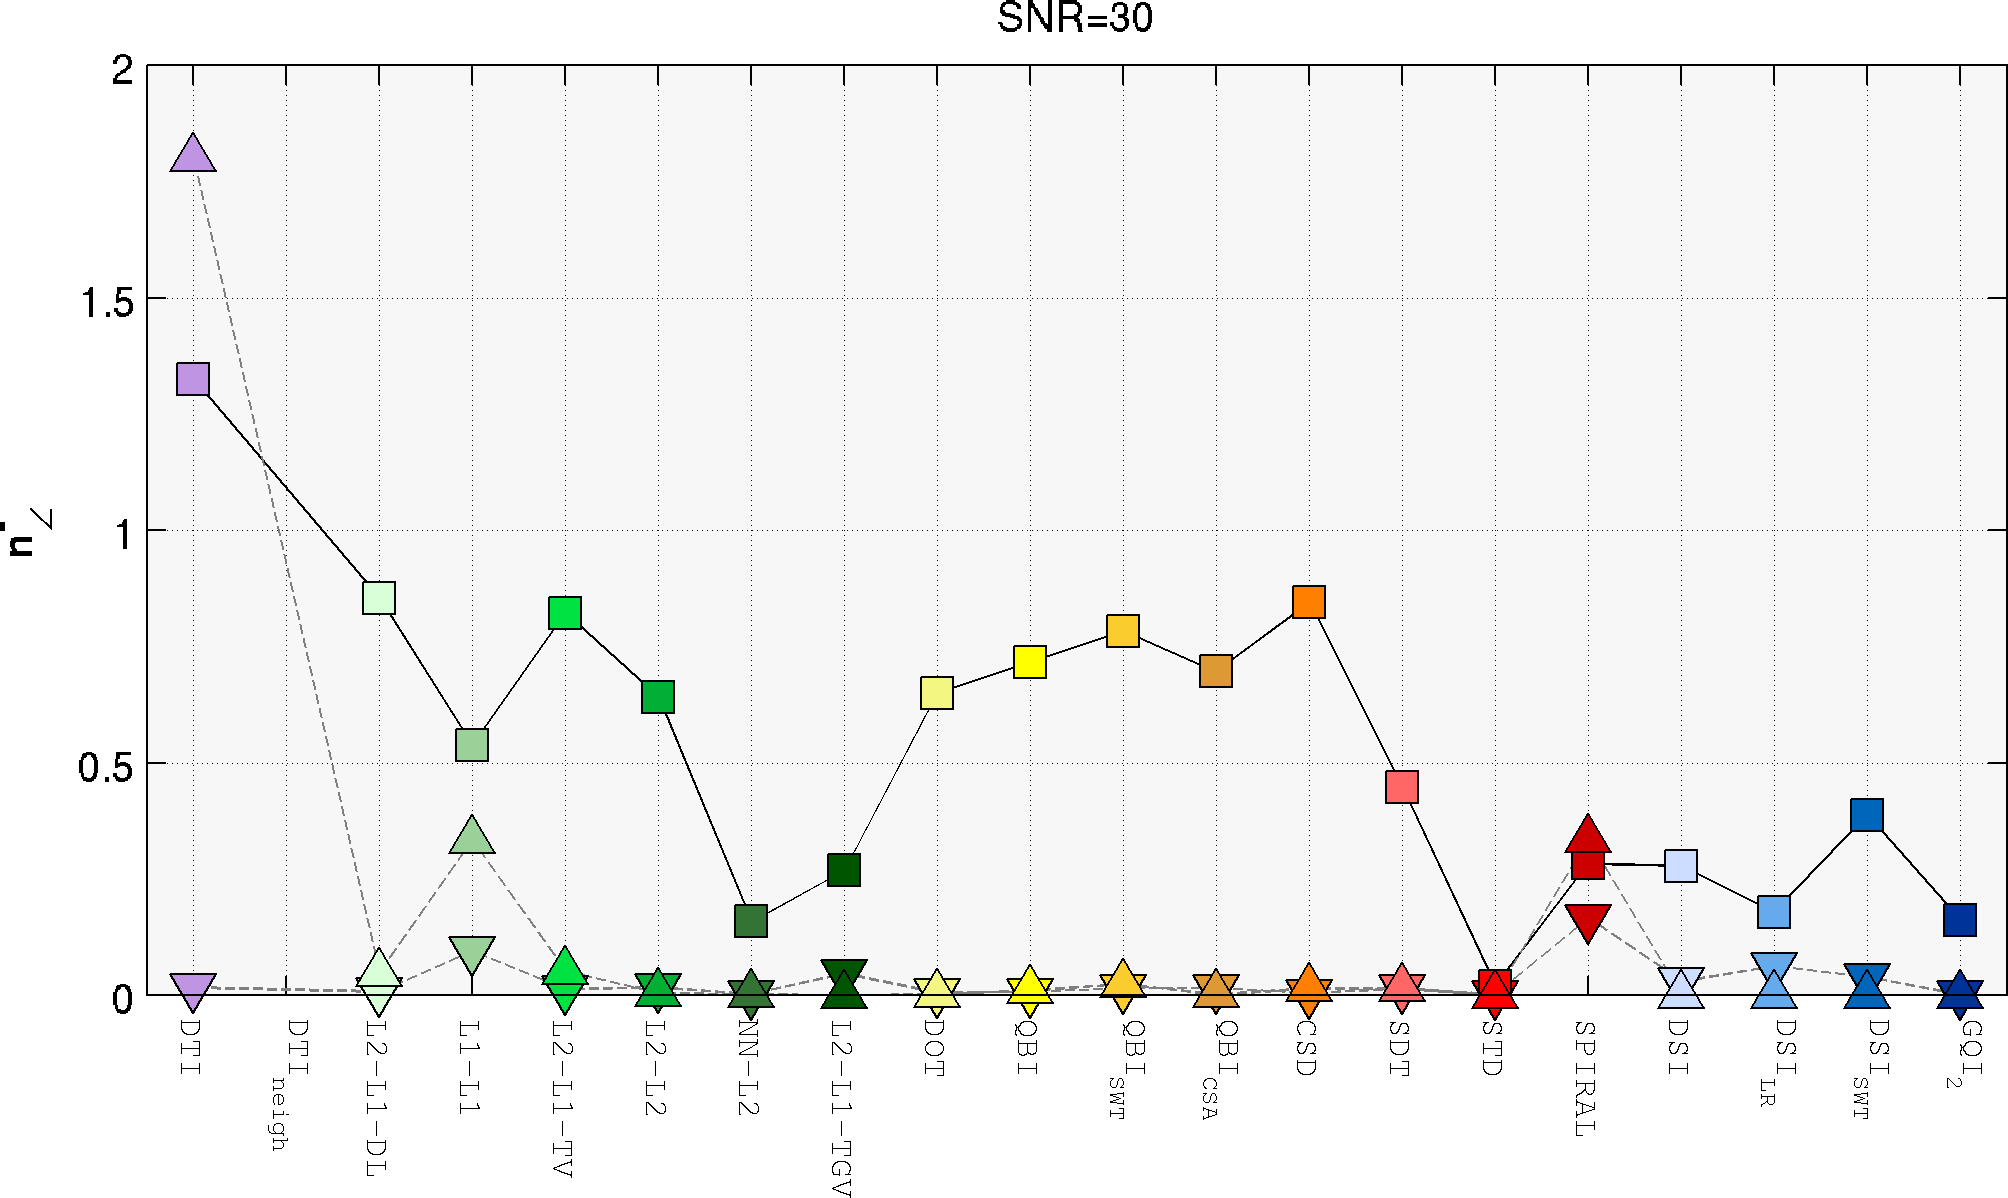
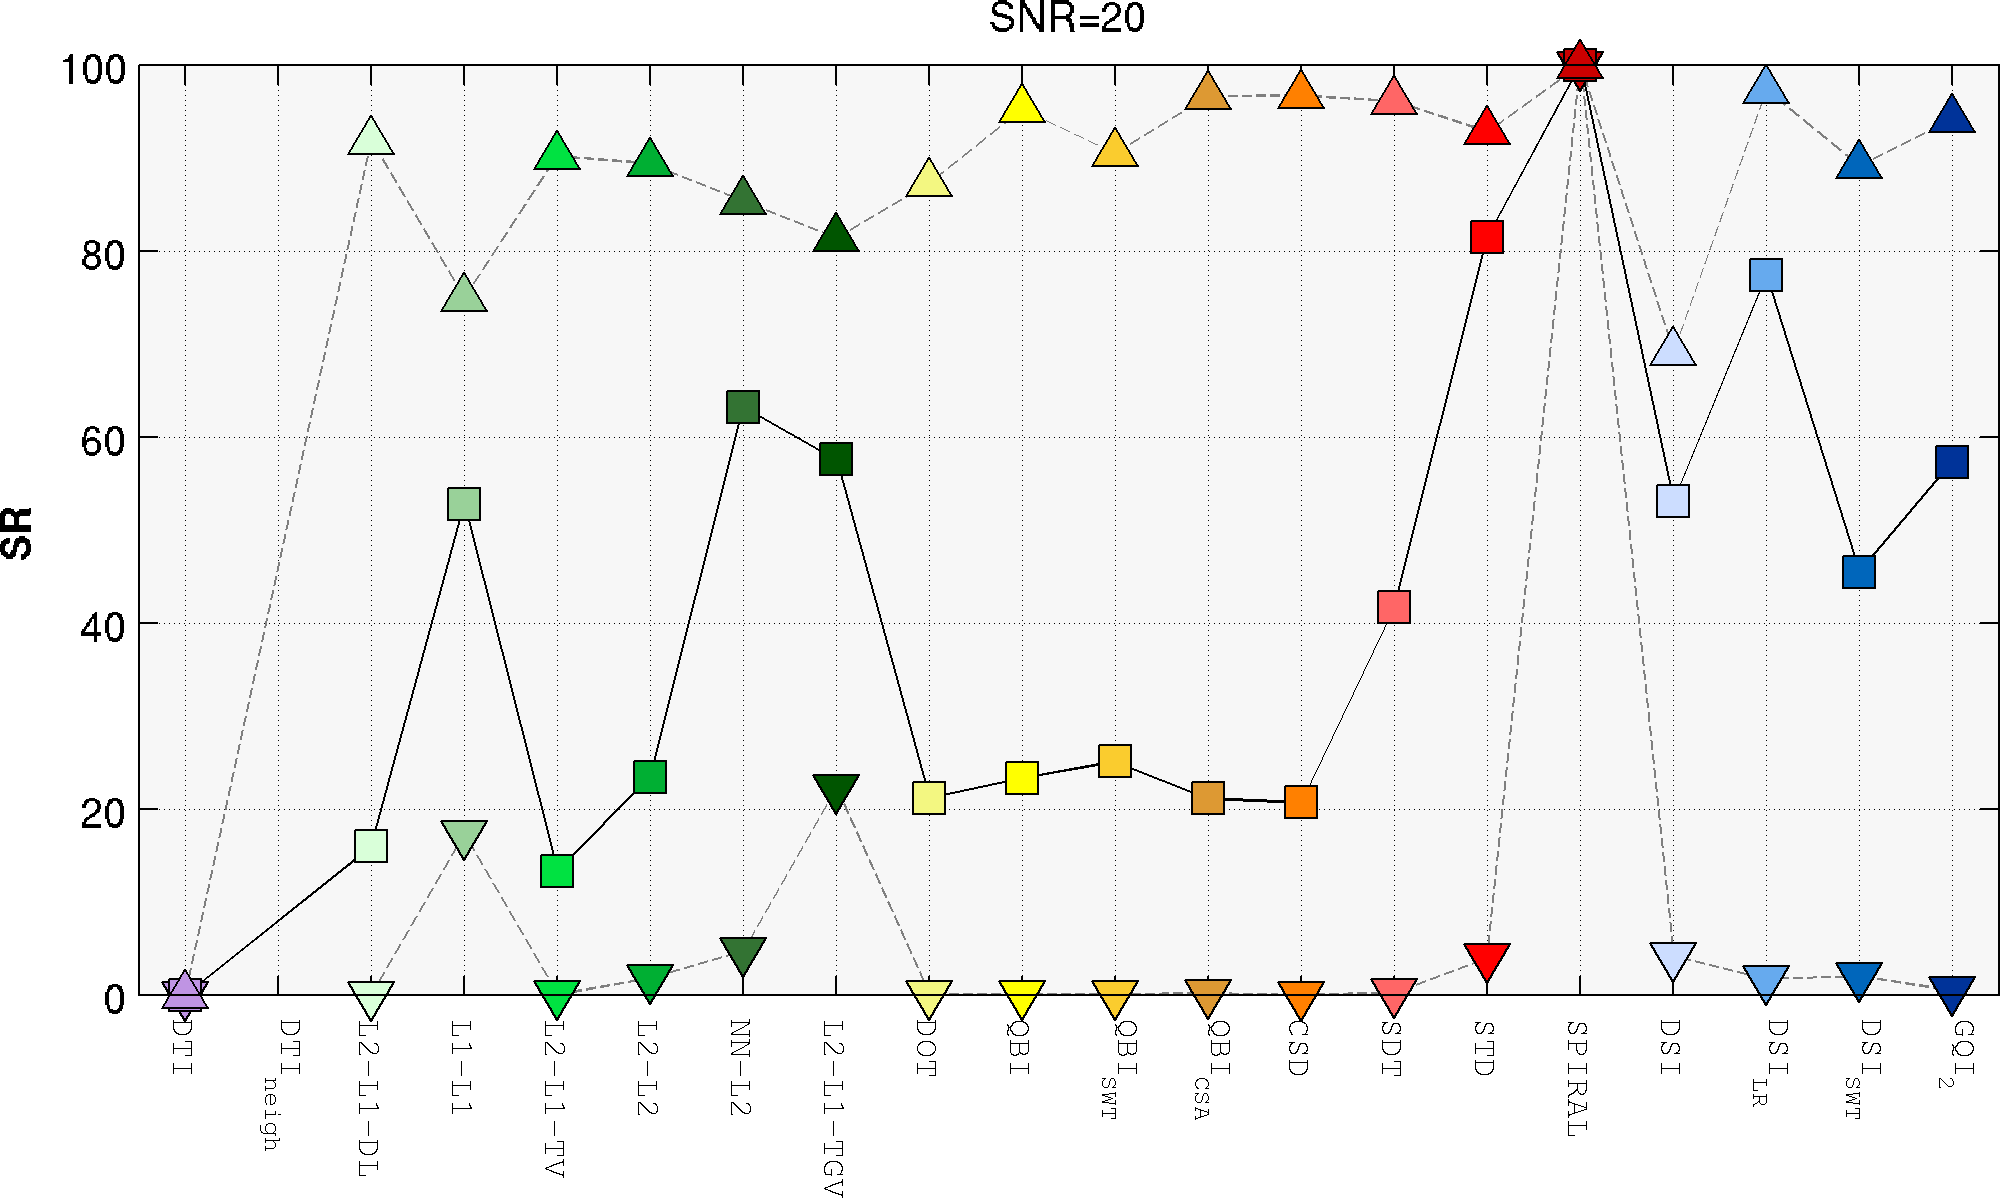
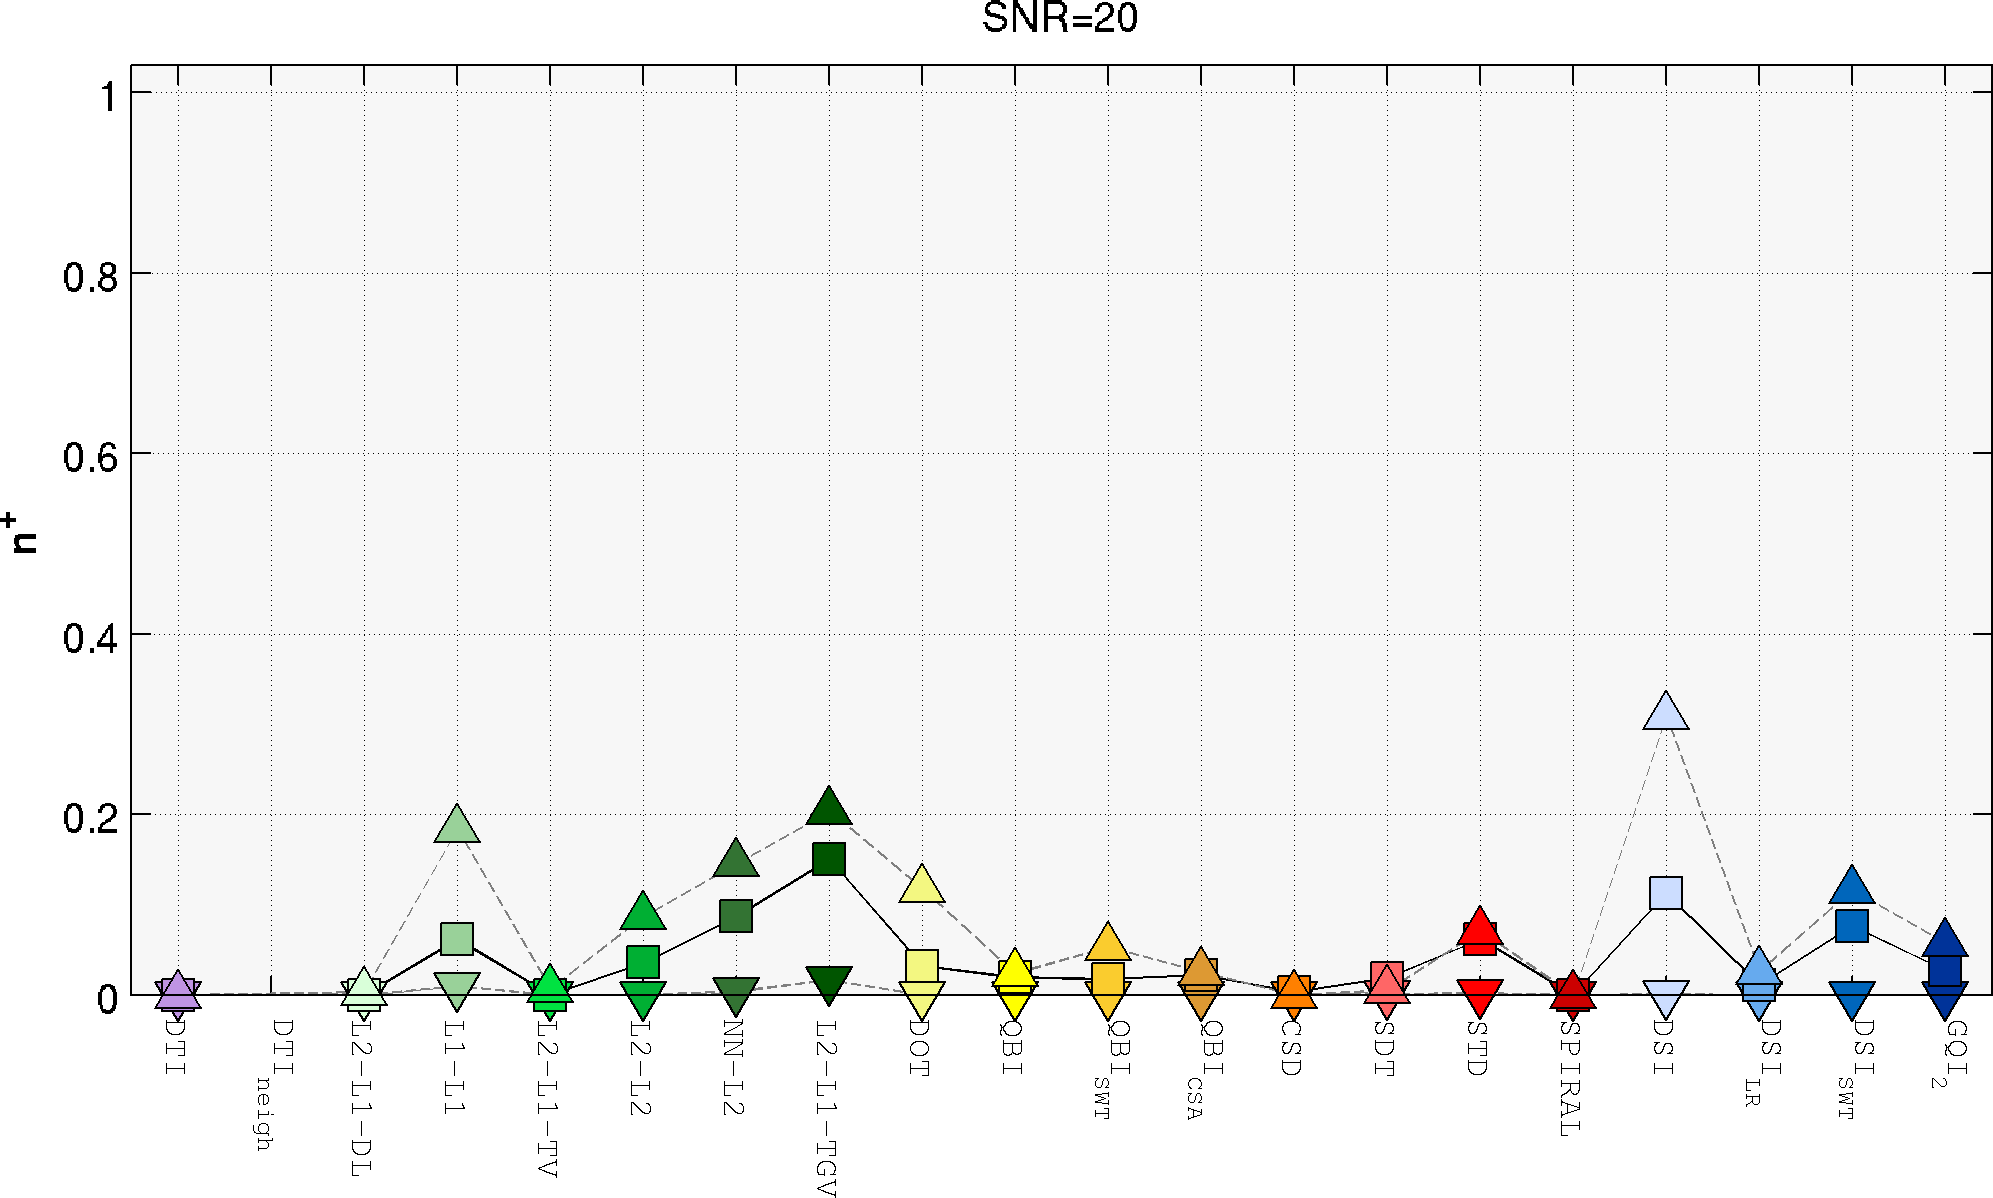
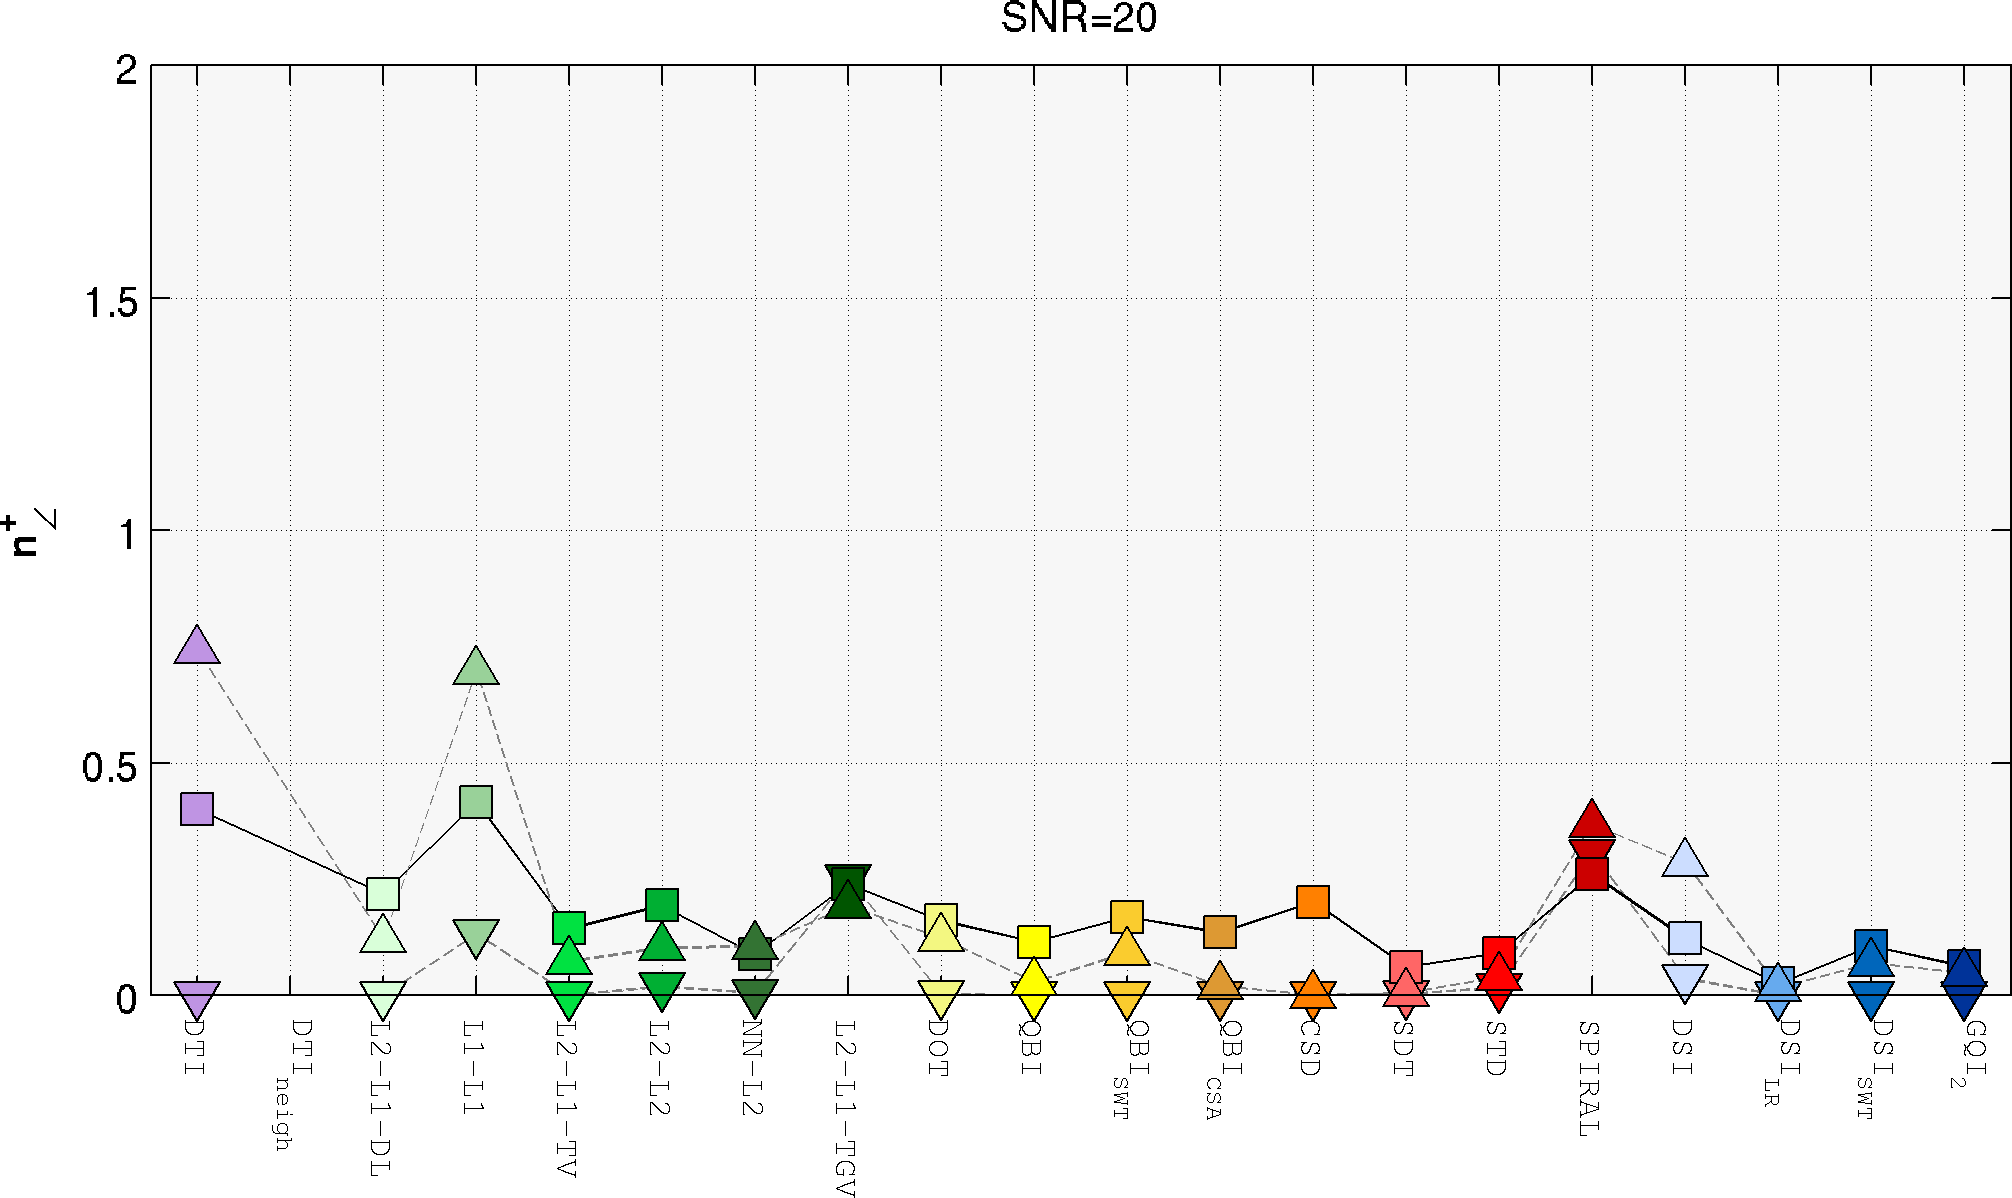
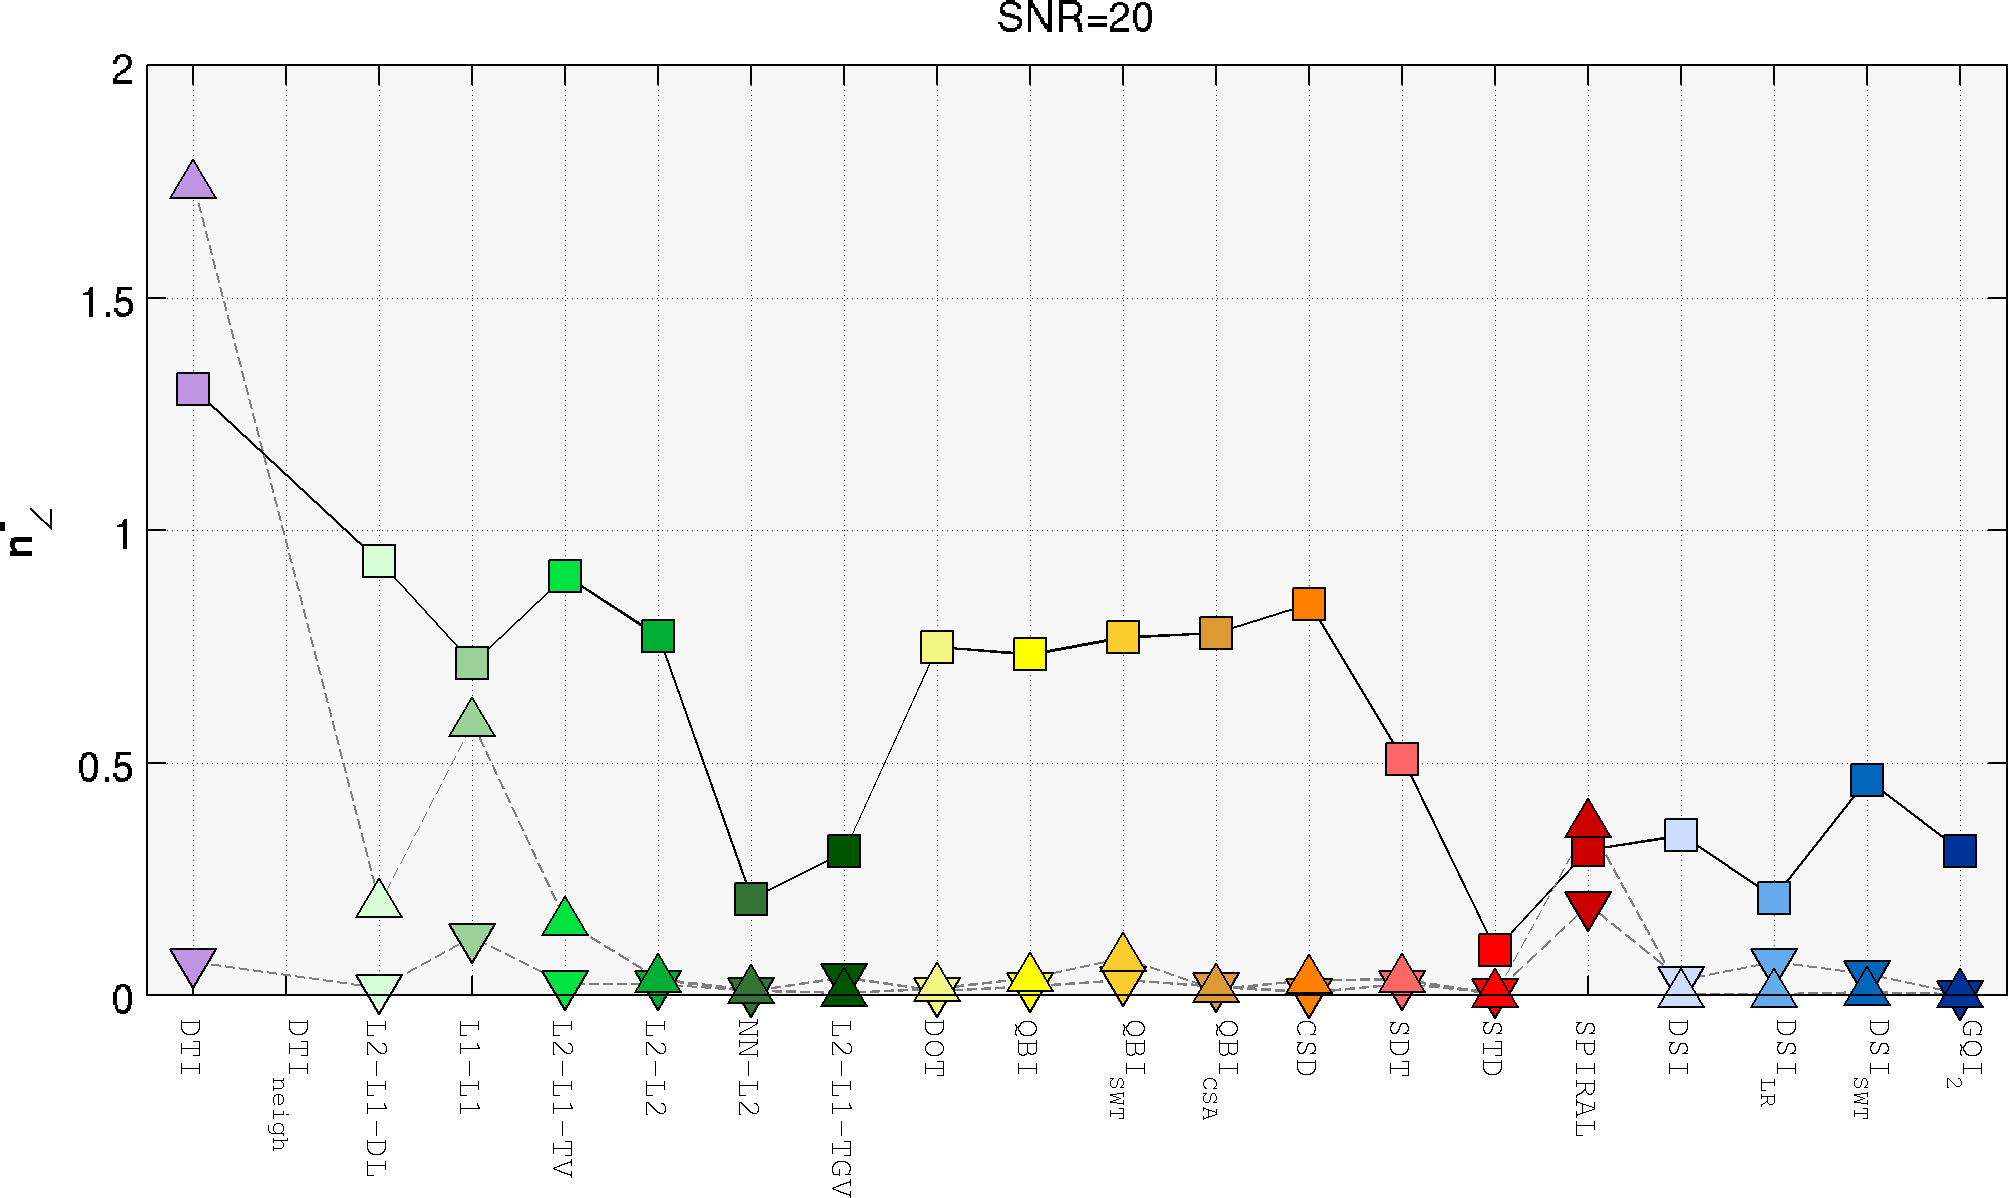
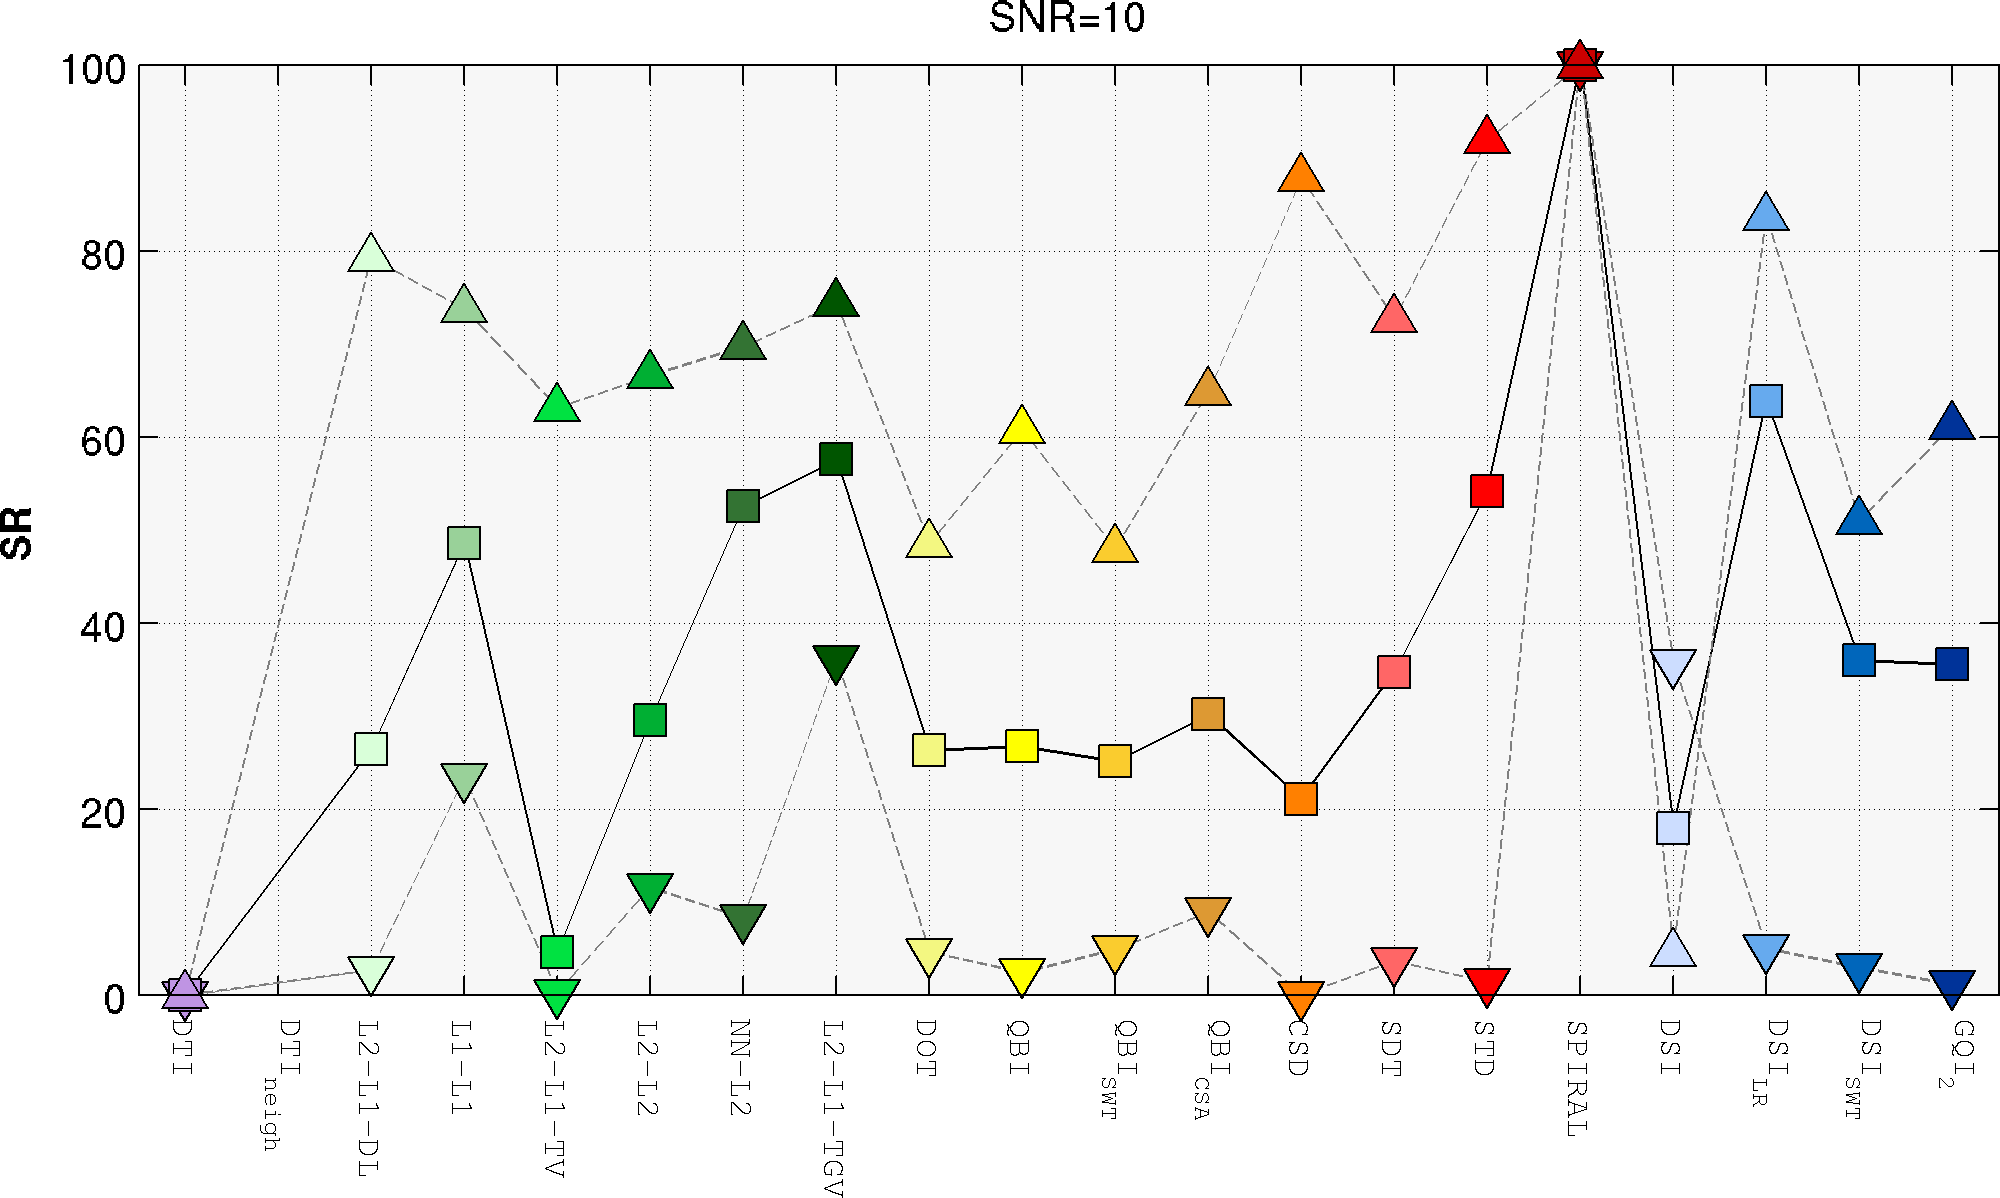
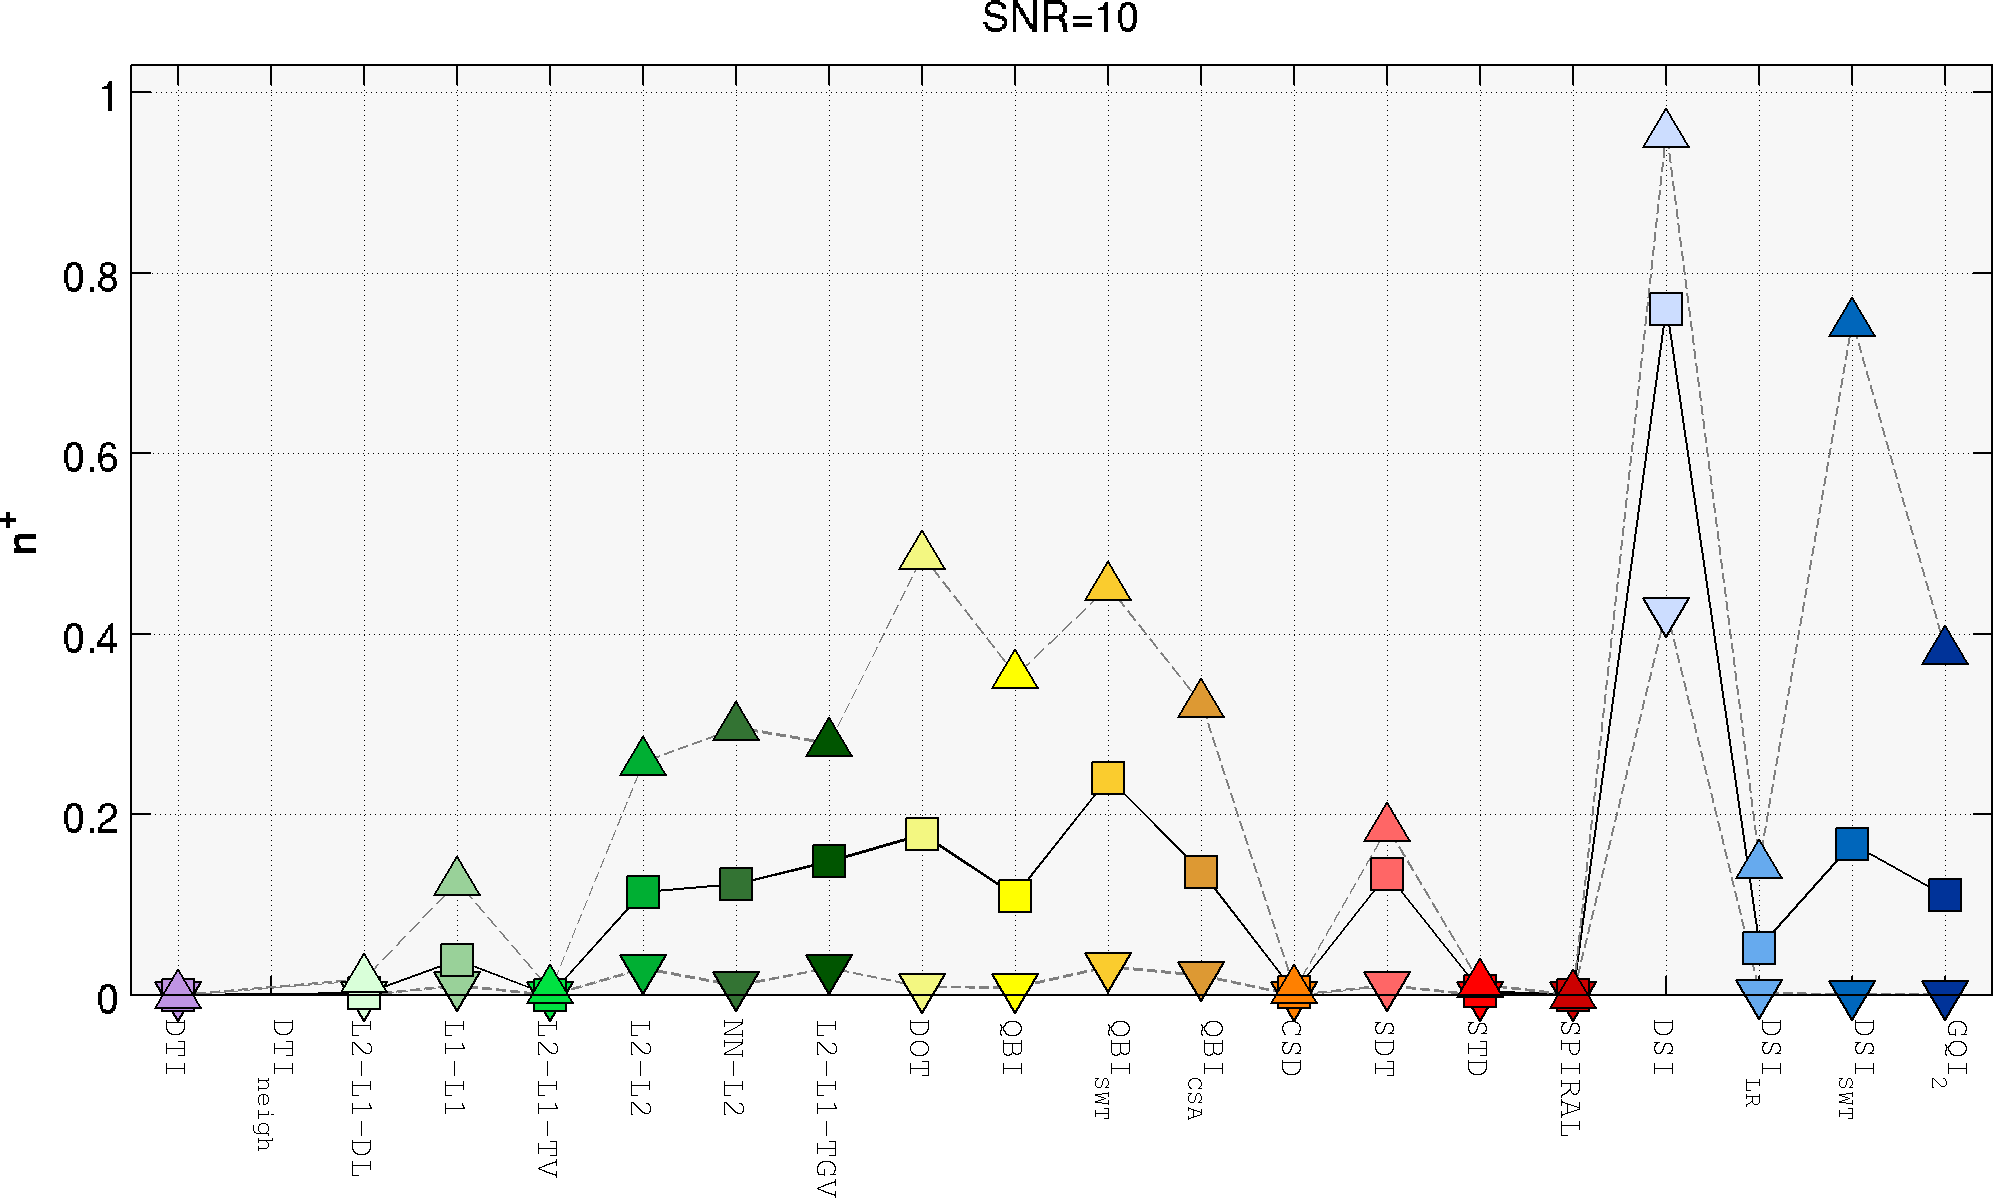
To help the reader in highlighting differences and similarities among the algorithms, the scores are also summarized in three separate ranges of crossing angles:  (downward triangles),
  (squares) and
  (upward triangles).