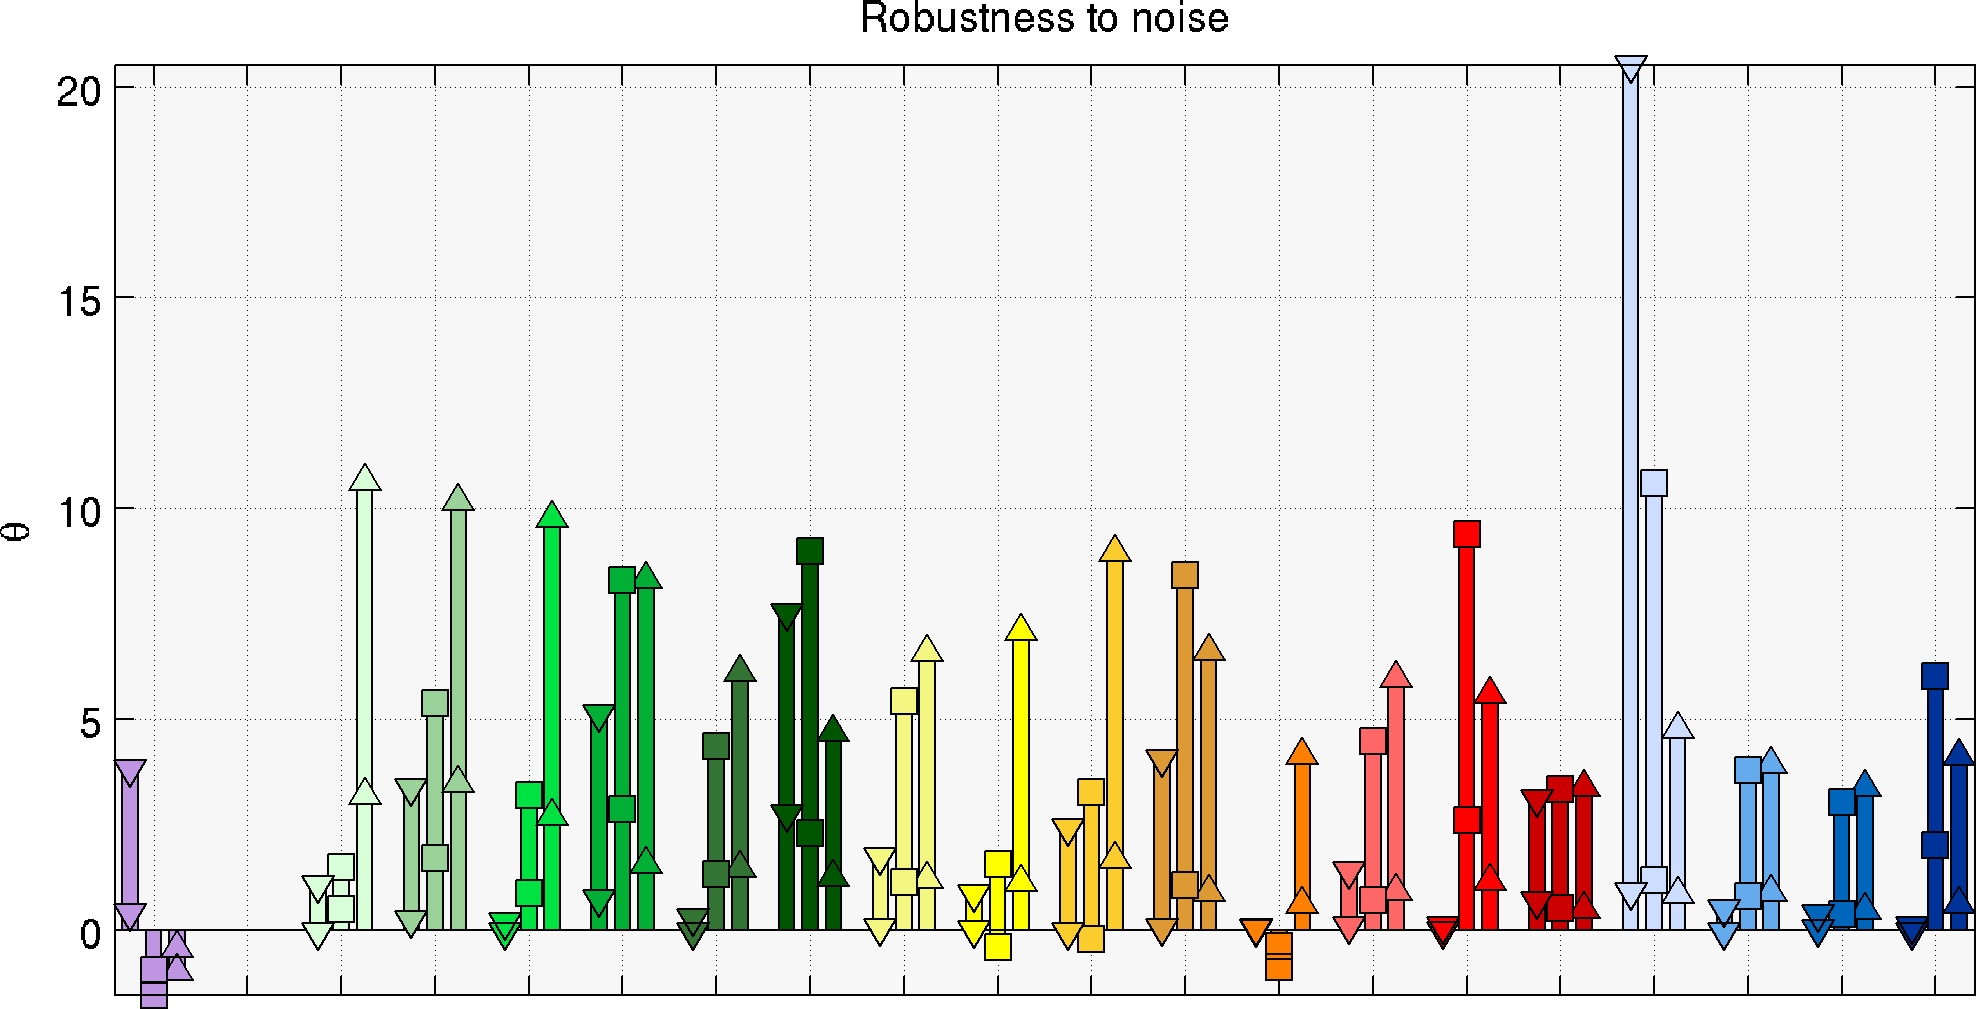
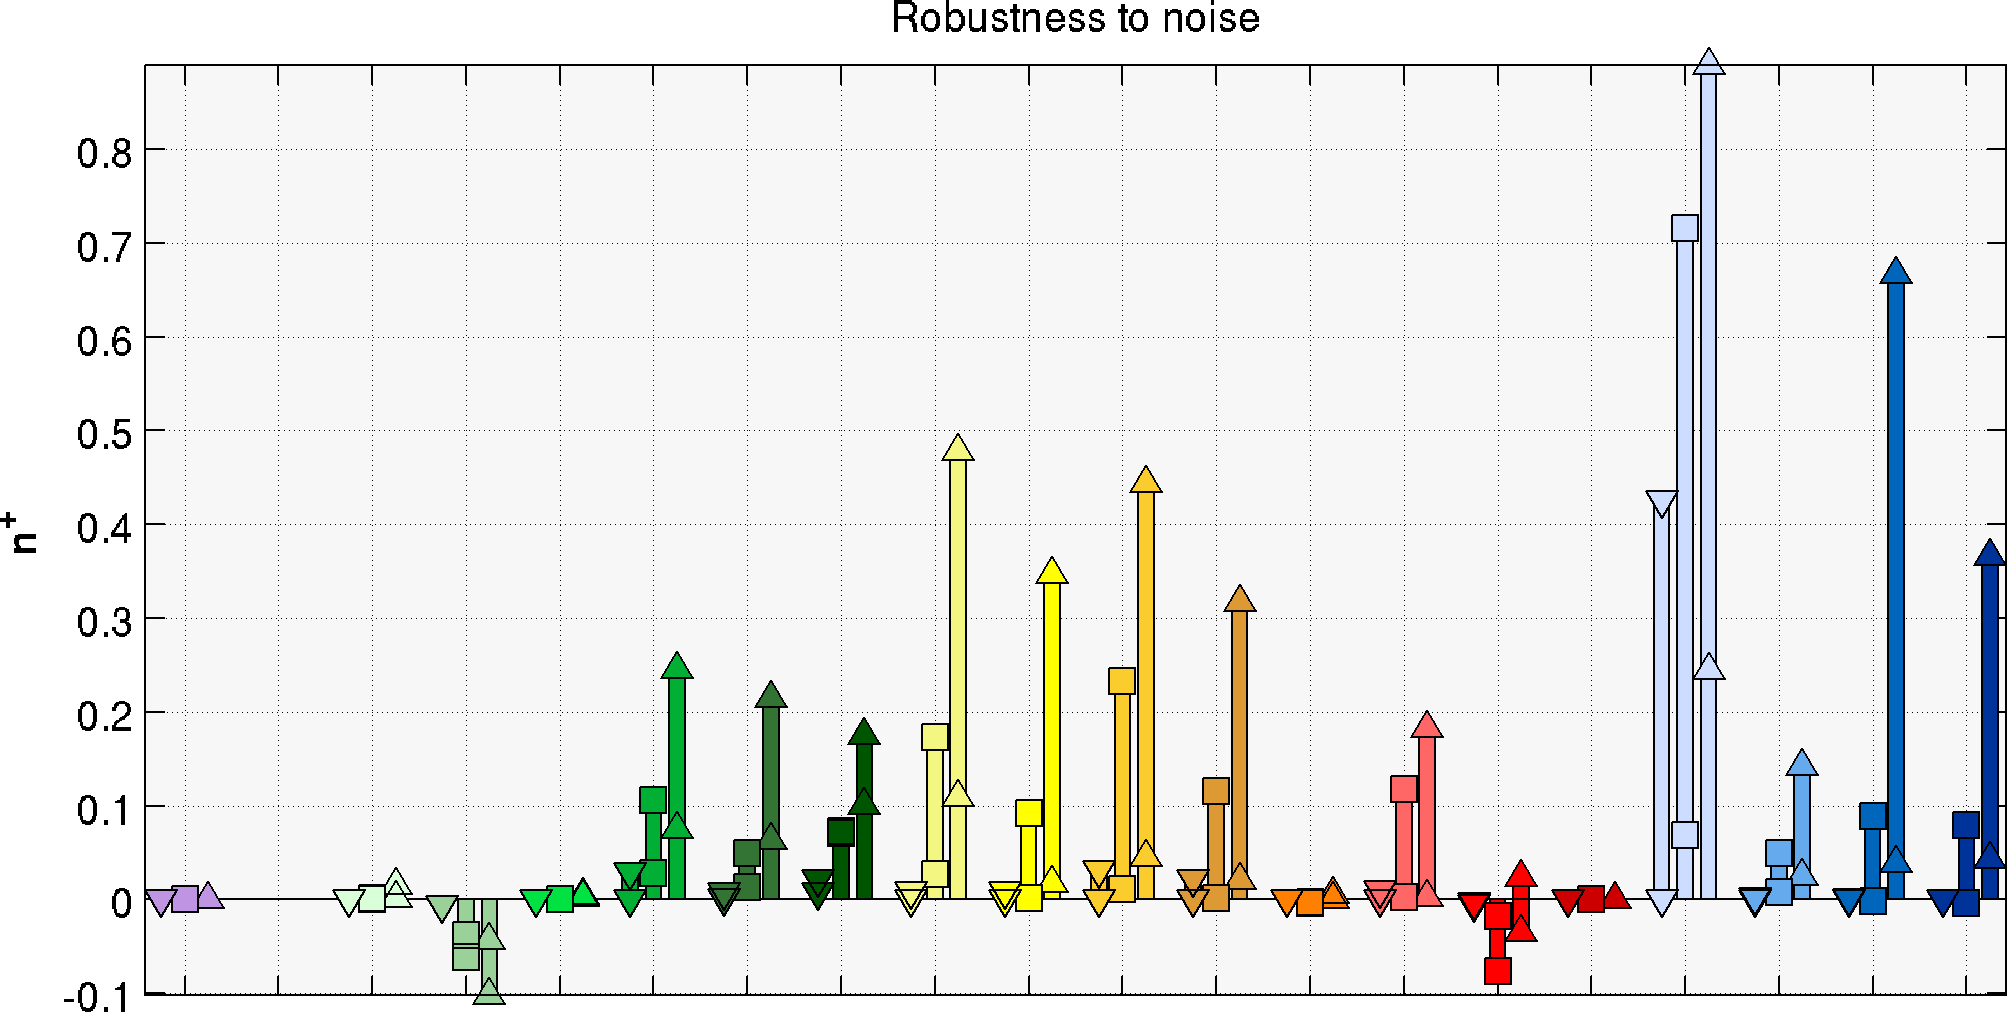
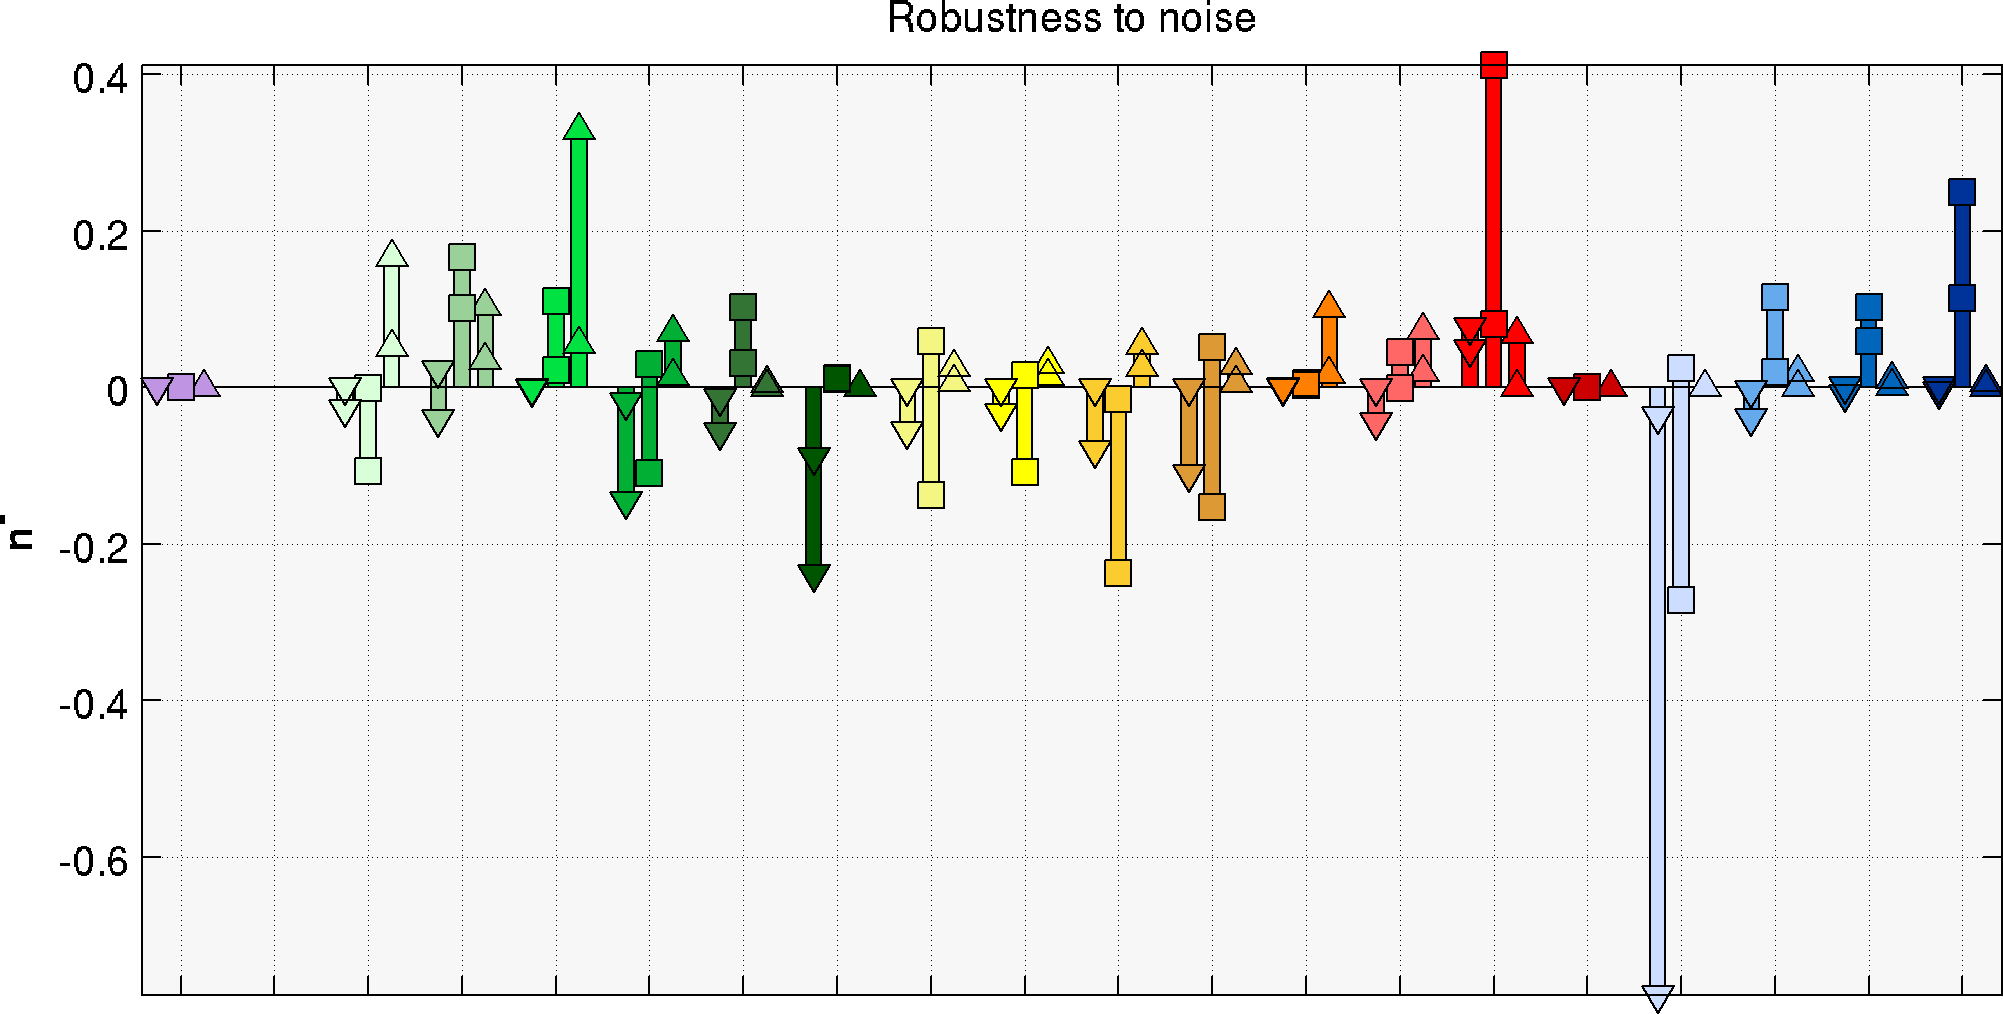
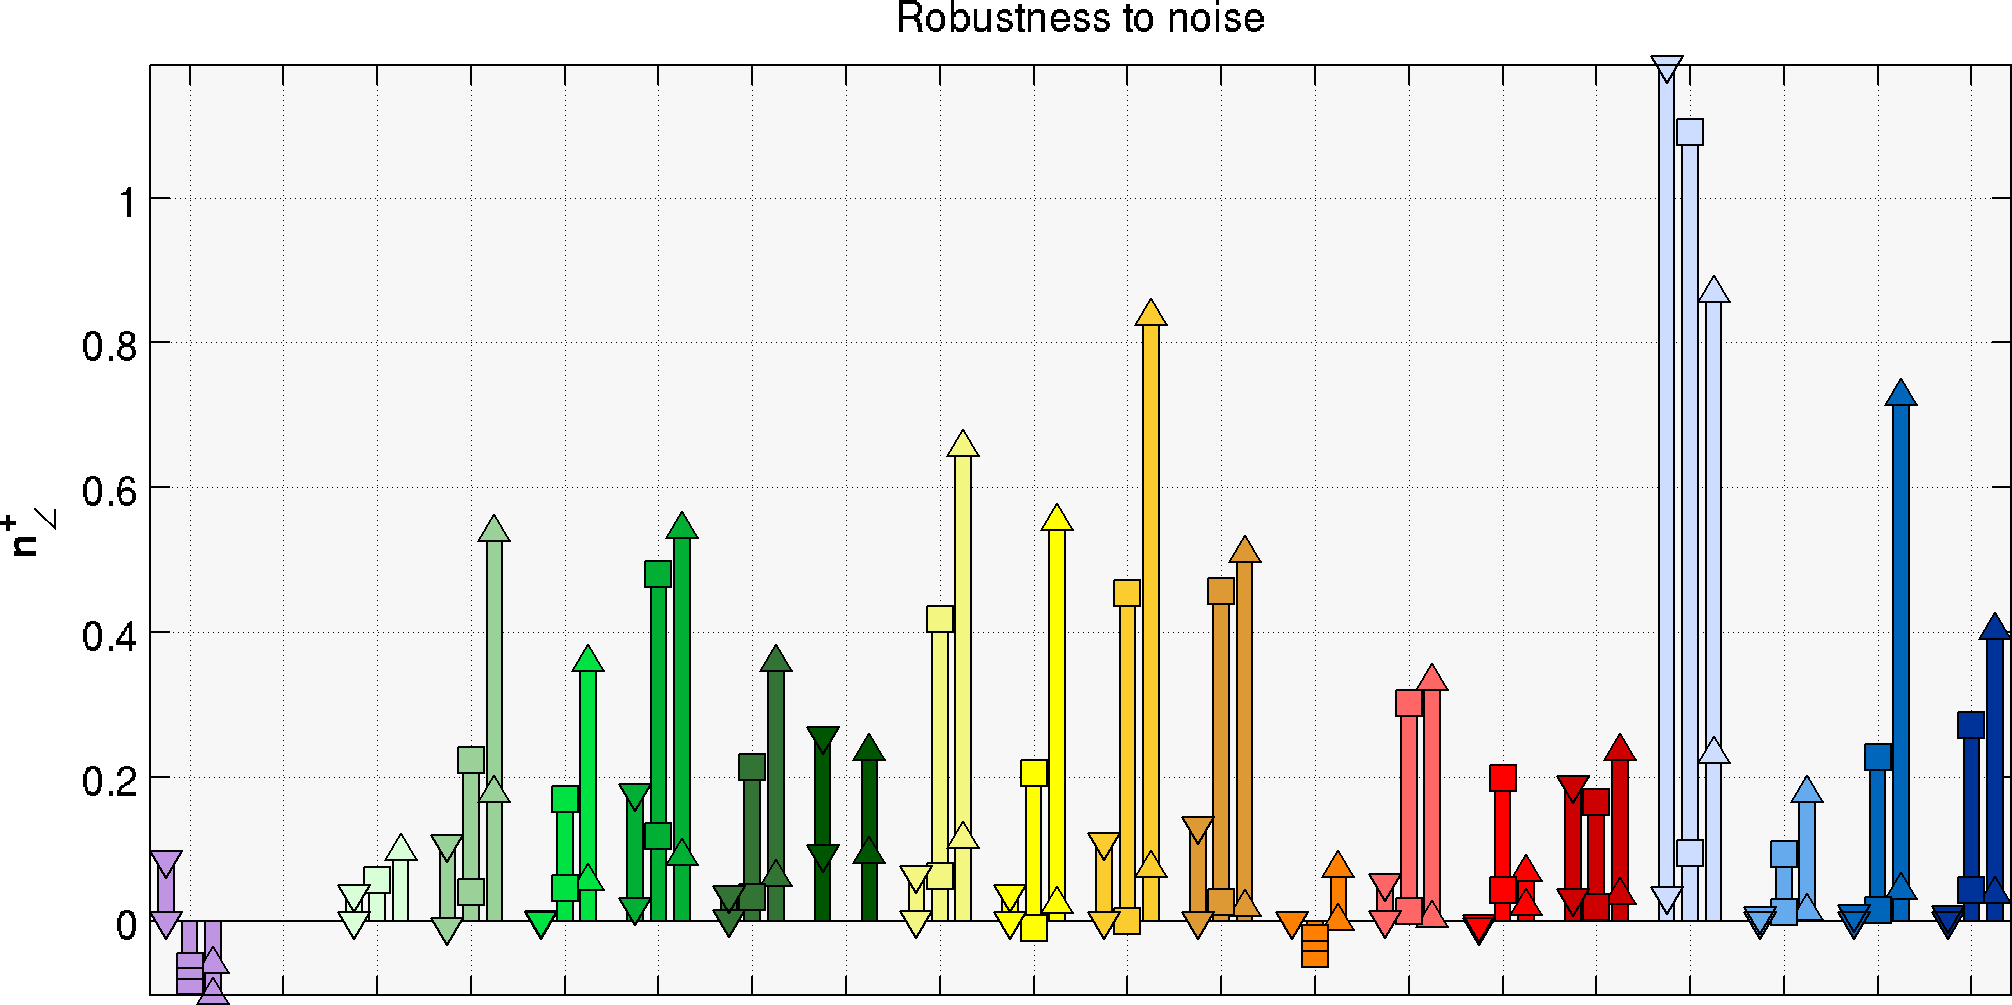
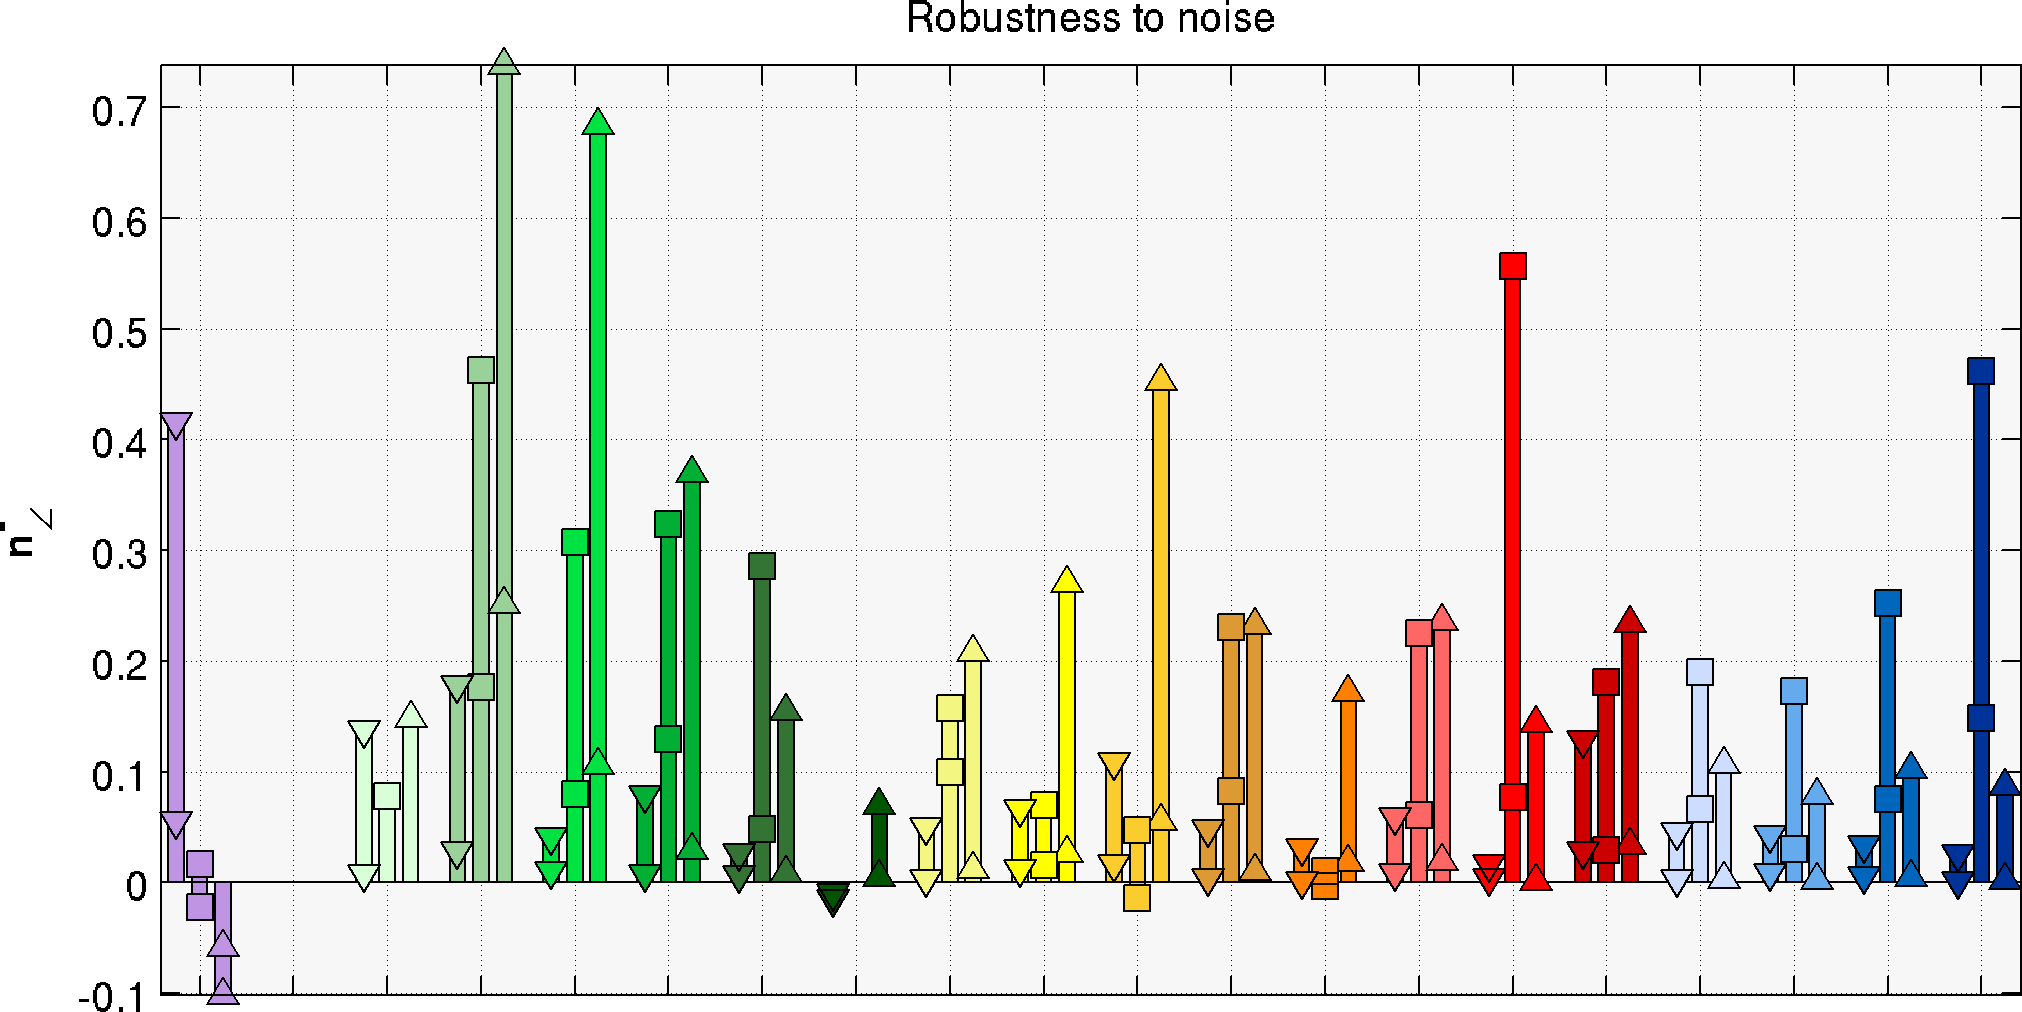
The following plots compare all reconstruction methods with respect to the sensitivity to noise of the corresponding reconstructions. The performances obtained at a SNR=30 are taken as reference and the variation of the scores is reported for SNR=20 and SNR=10, which resemble more closely the typical SNR in real dMRI data. Positive values mean a degradation of the performances.
For each method, the variations of the estimated number and orientation of the fiber populations are reported as the noise level changes. The first mark of every bar corresponds to the difference between the scores at SNR=30 and those at SNR=20, while the second mark between SNR=30 and SNR=10.
Scores are reported in three separate ranges of crossing angles:  (downward triangles),
  (squares) and
  (upward triangles).