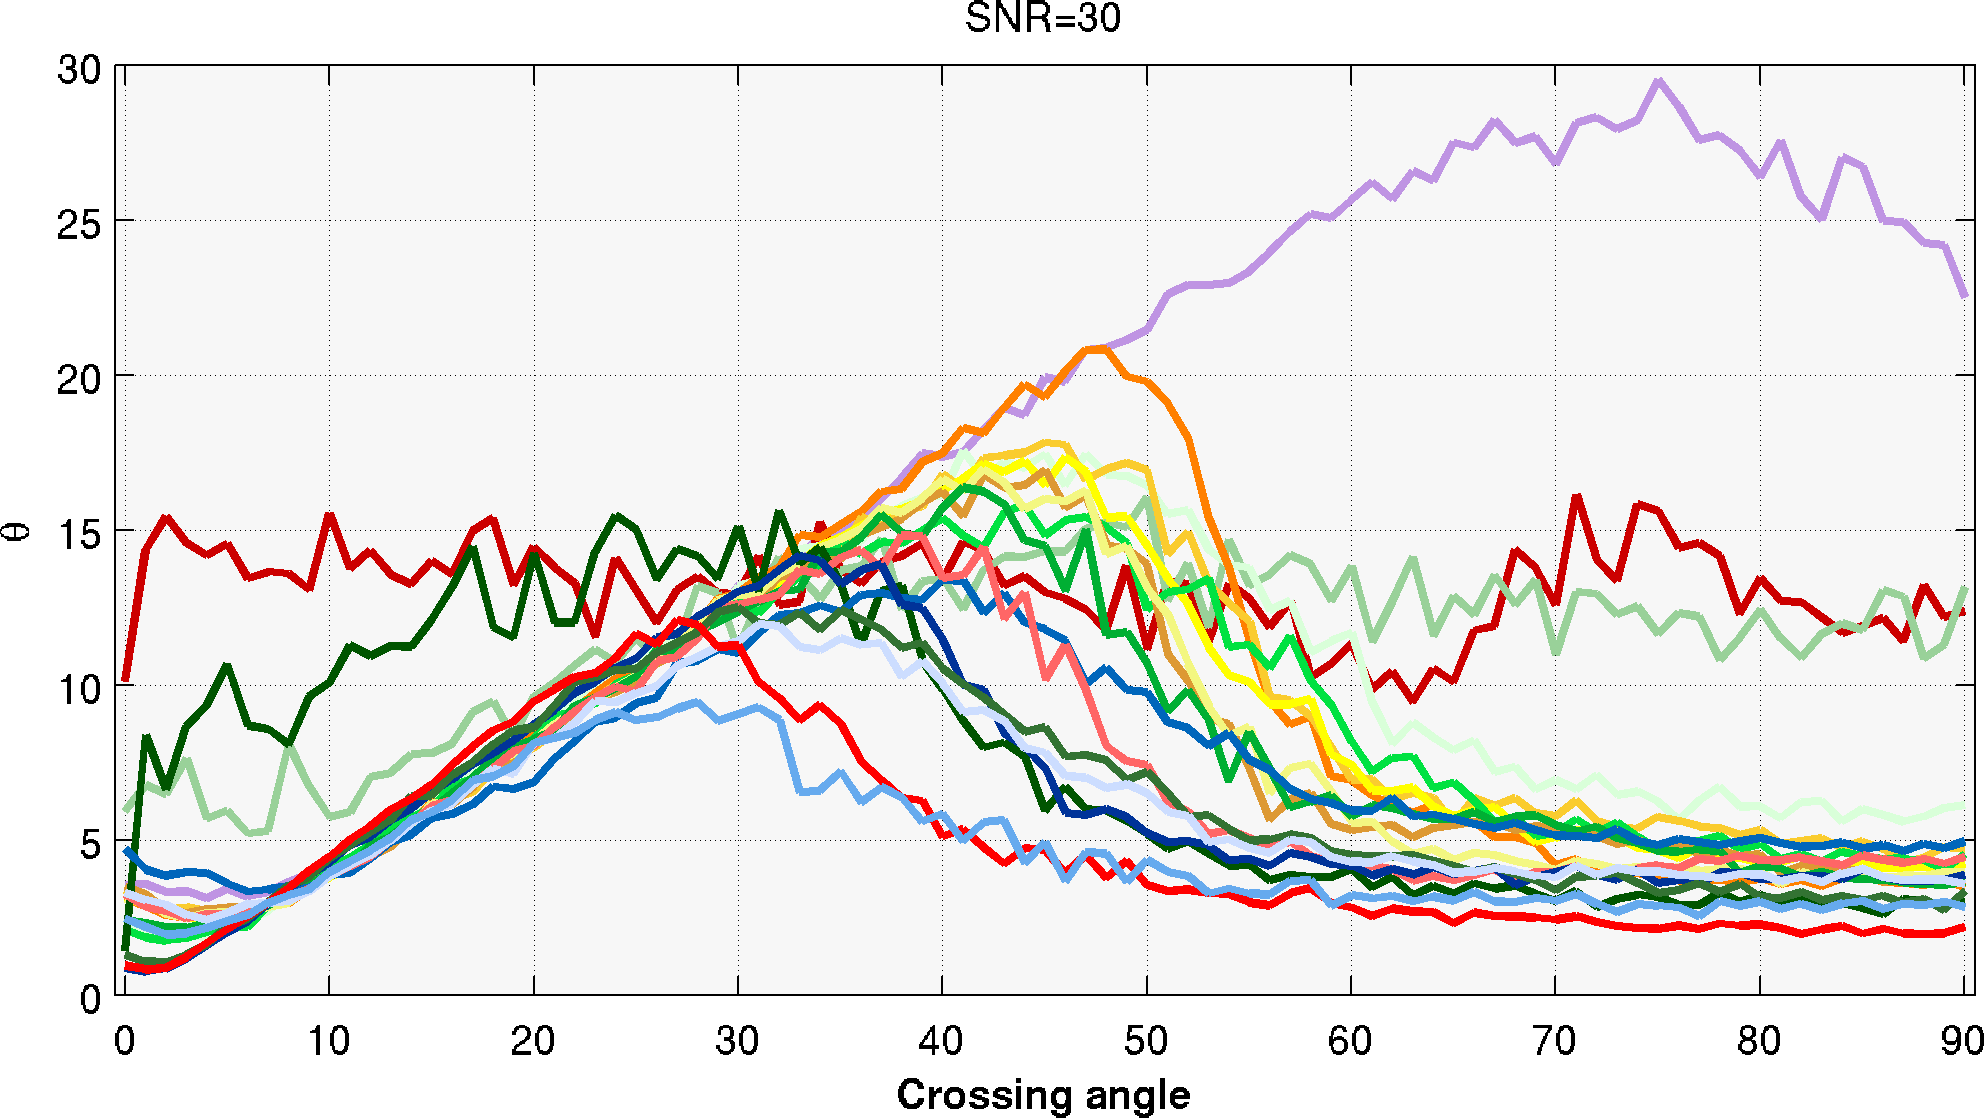
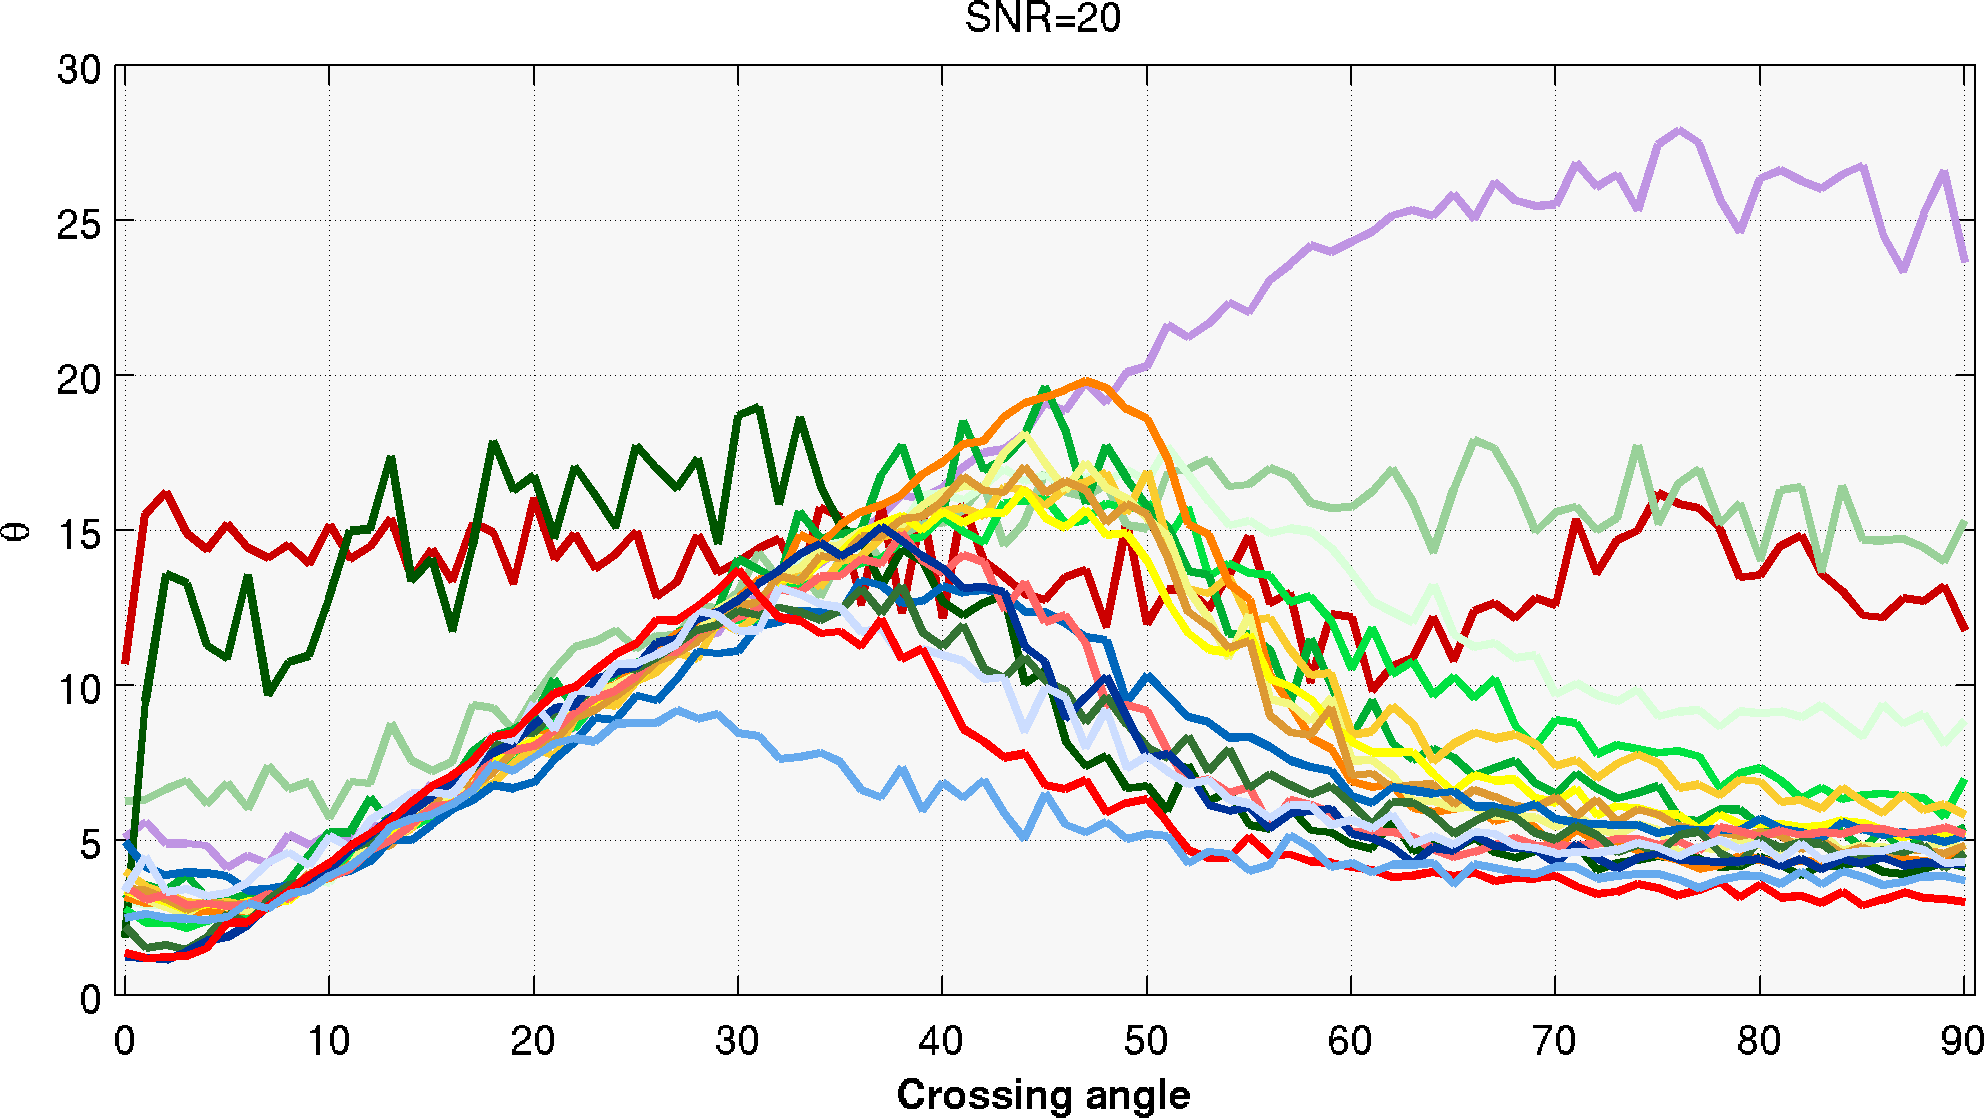
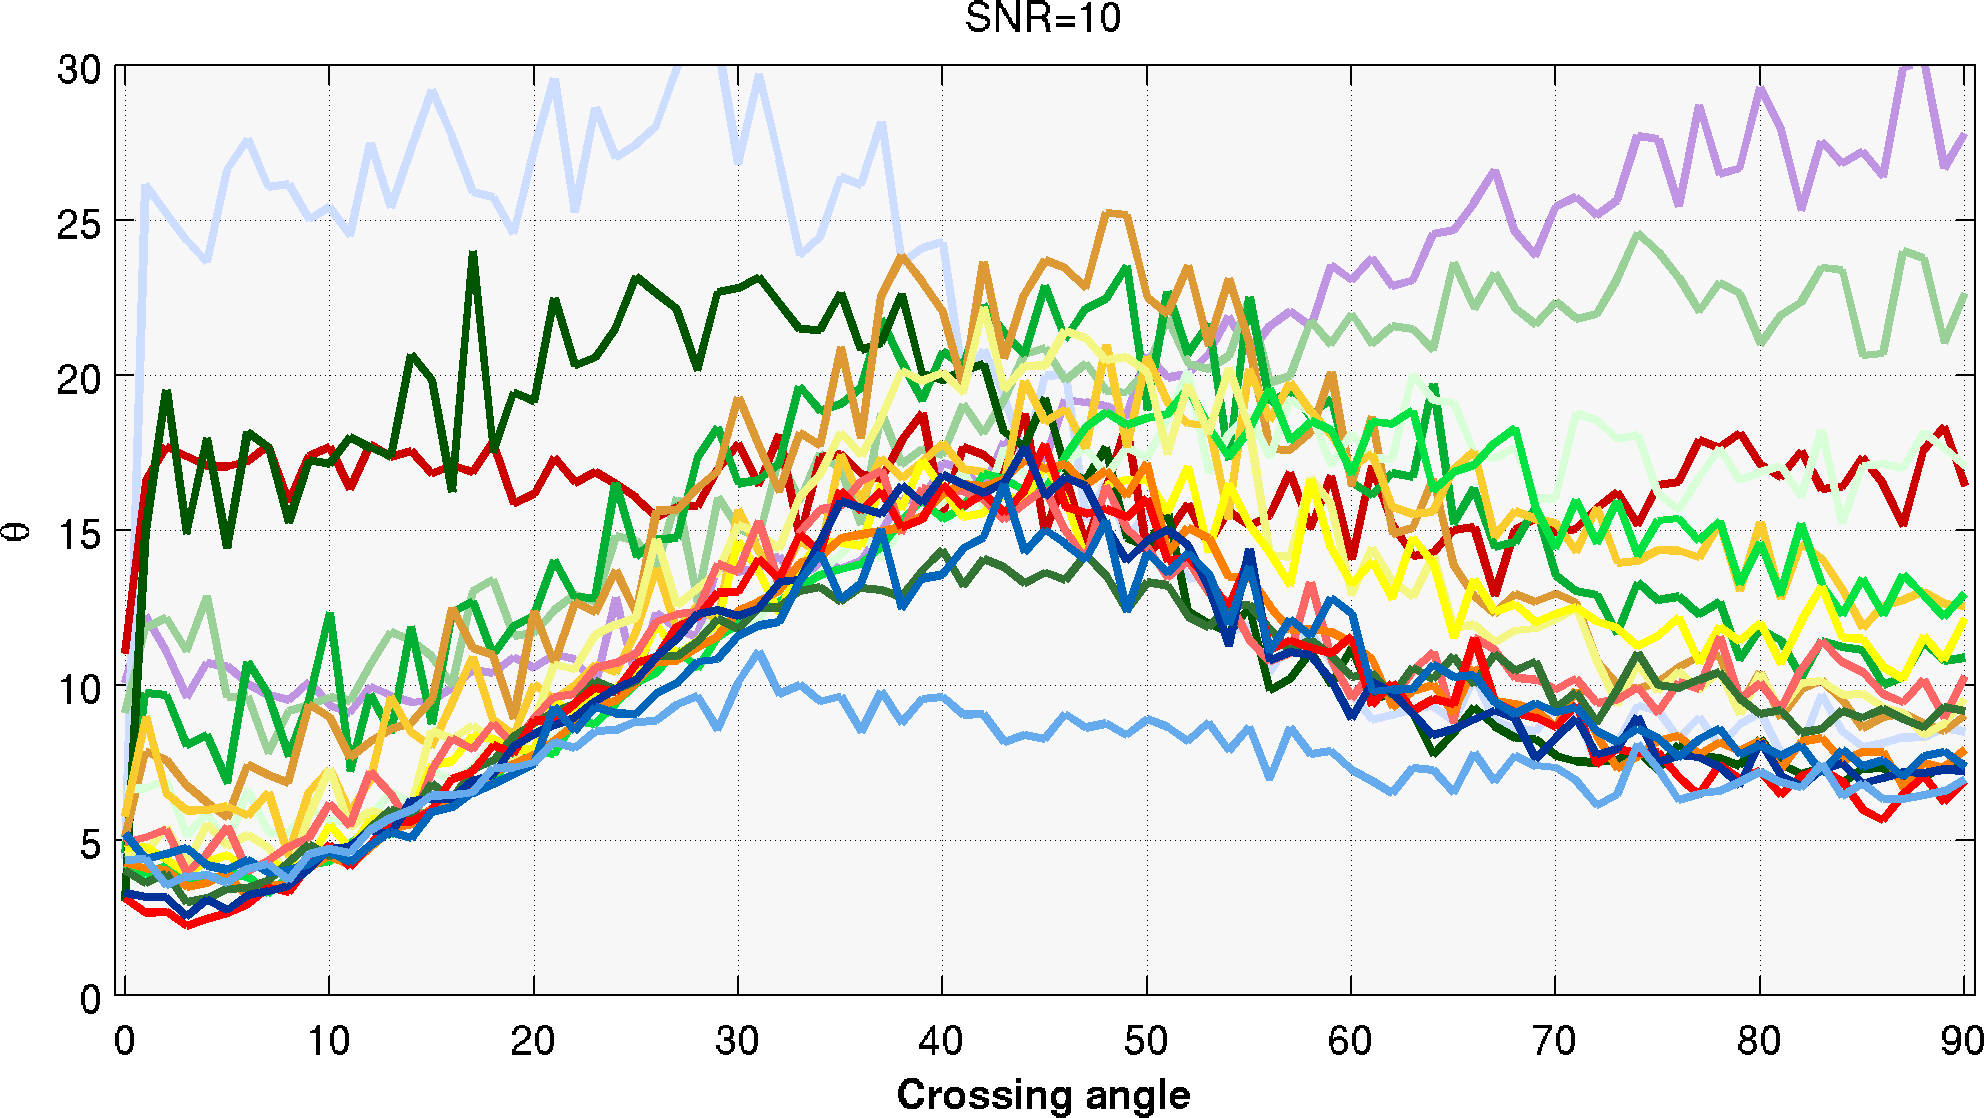
The following plots compare all reconstruction methods with respect to the accuracy in the orientation of the estimated fiber populations,  , as a function of the crossing angle.
The average scores are plotted as a function of the crossing angle, where the angle between the two fiber populations was increased from  to
to  .
.
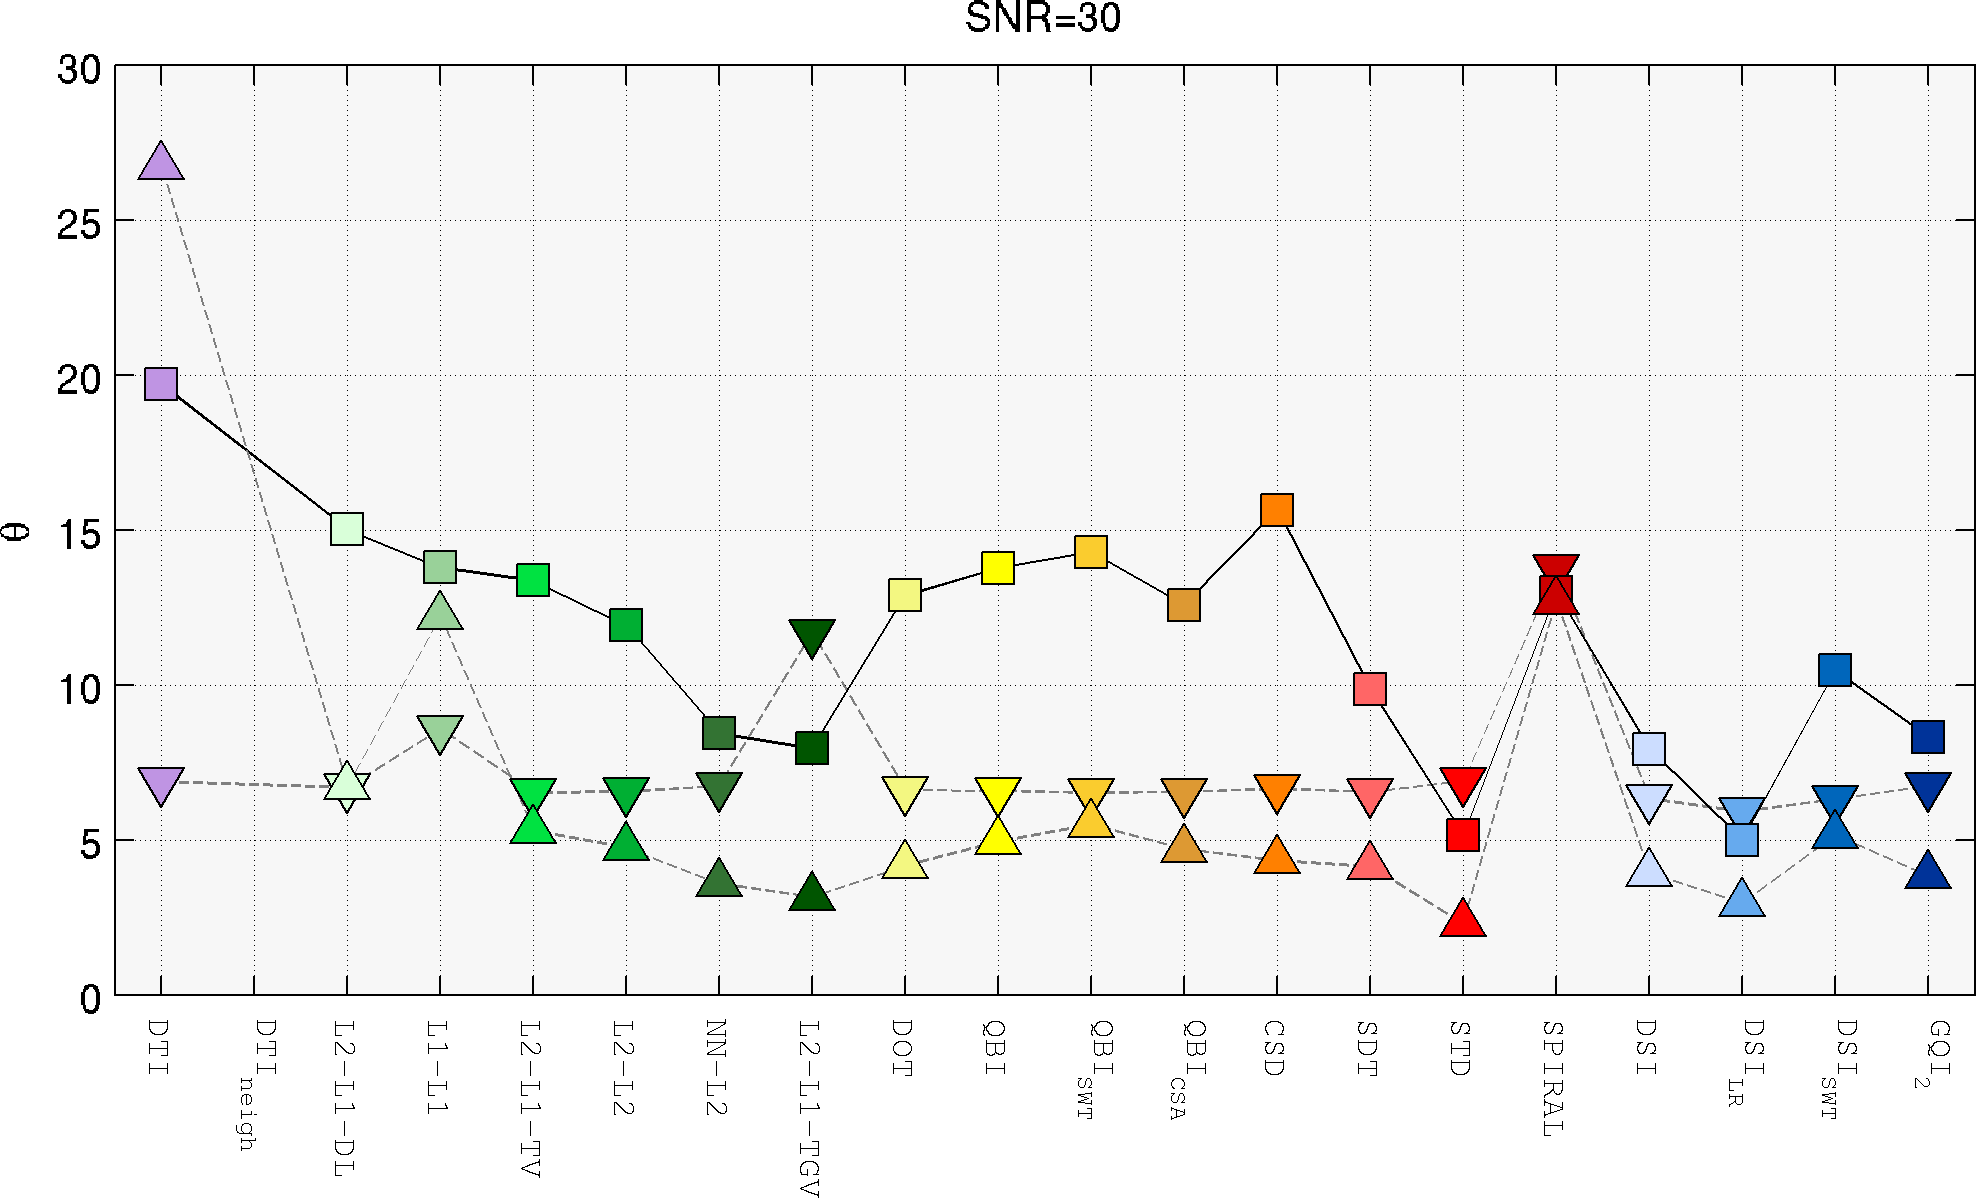
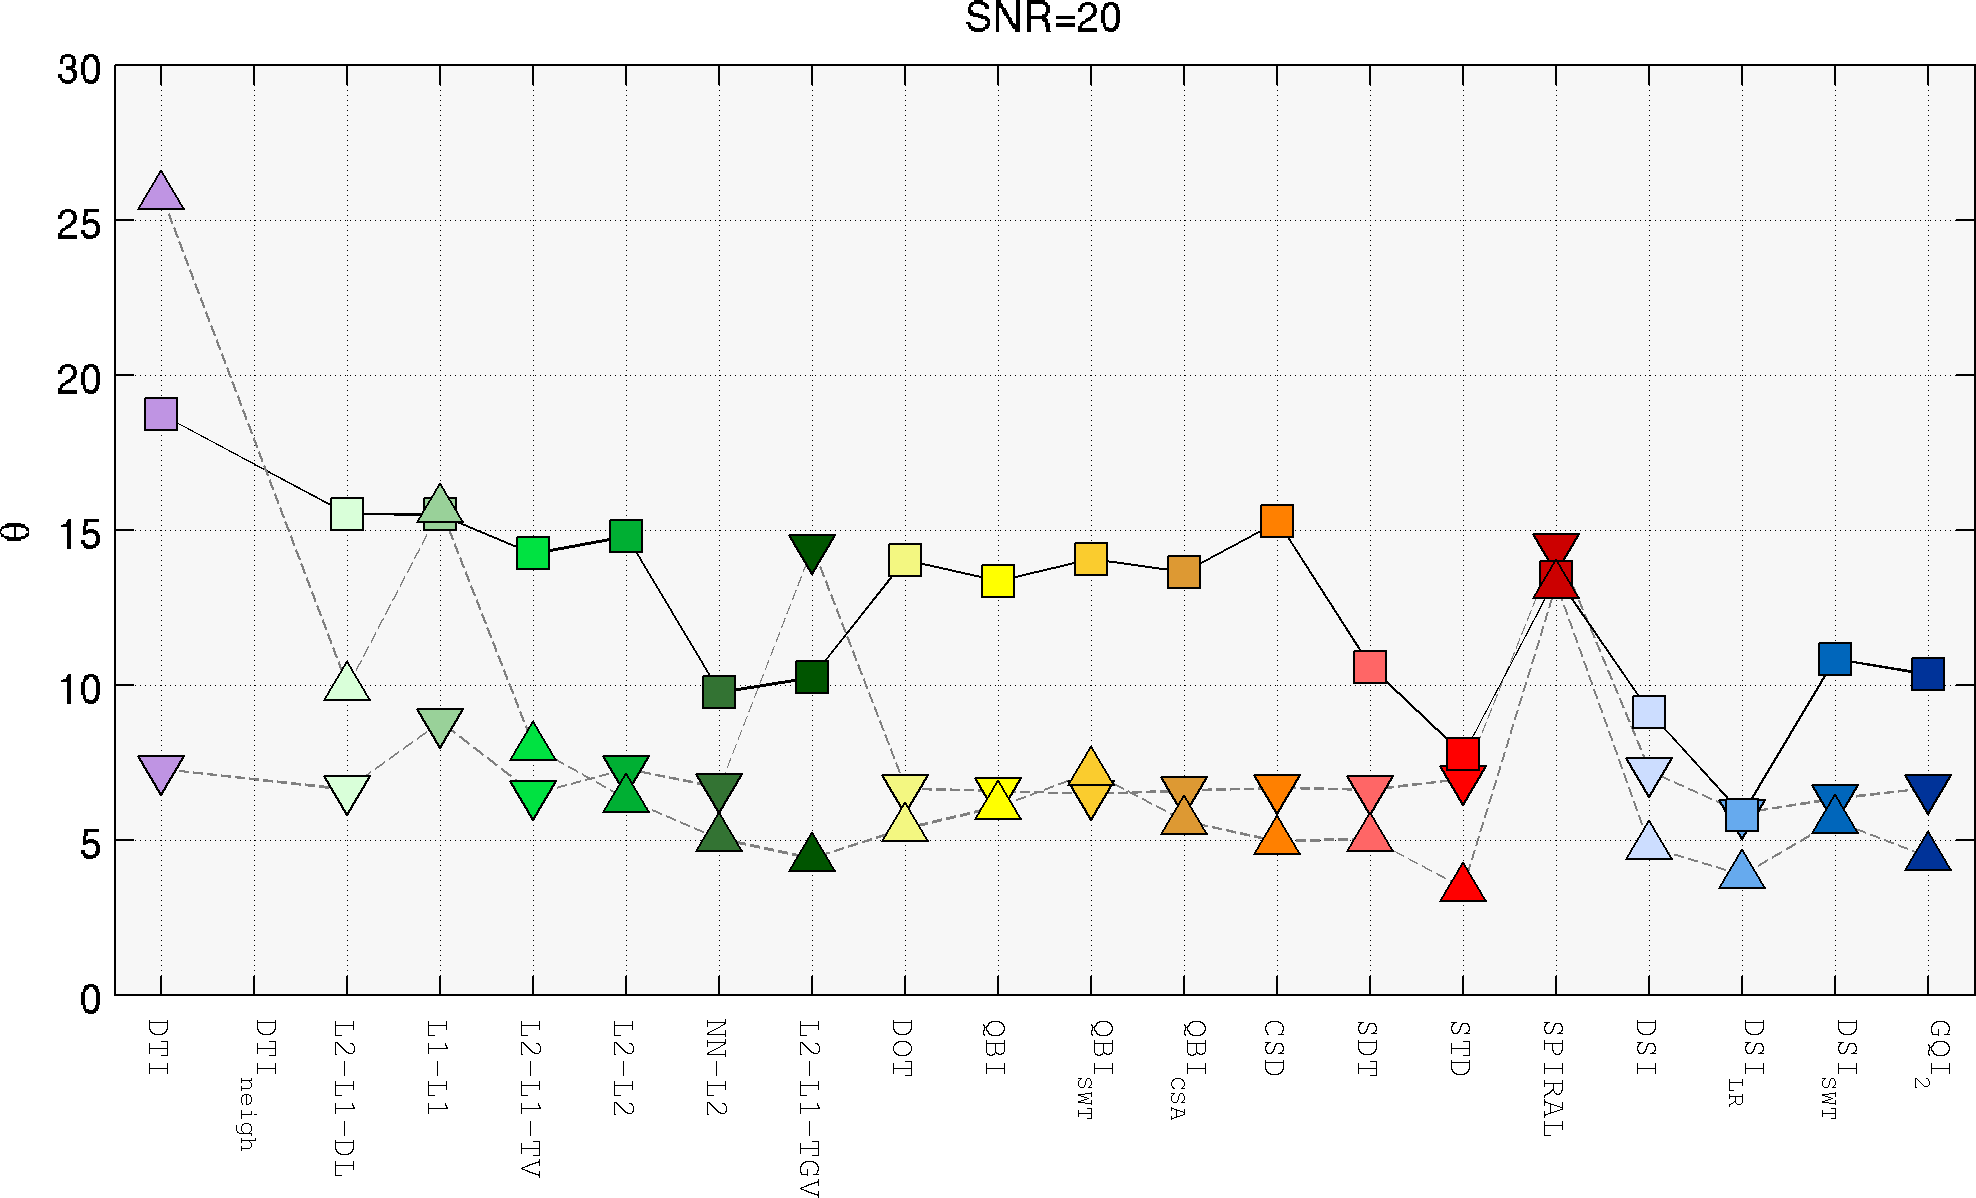
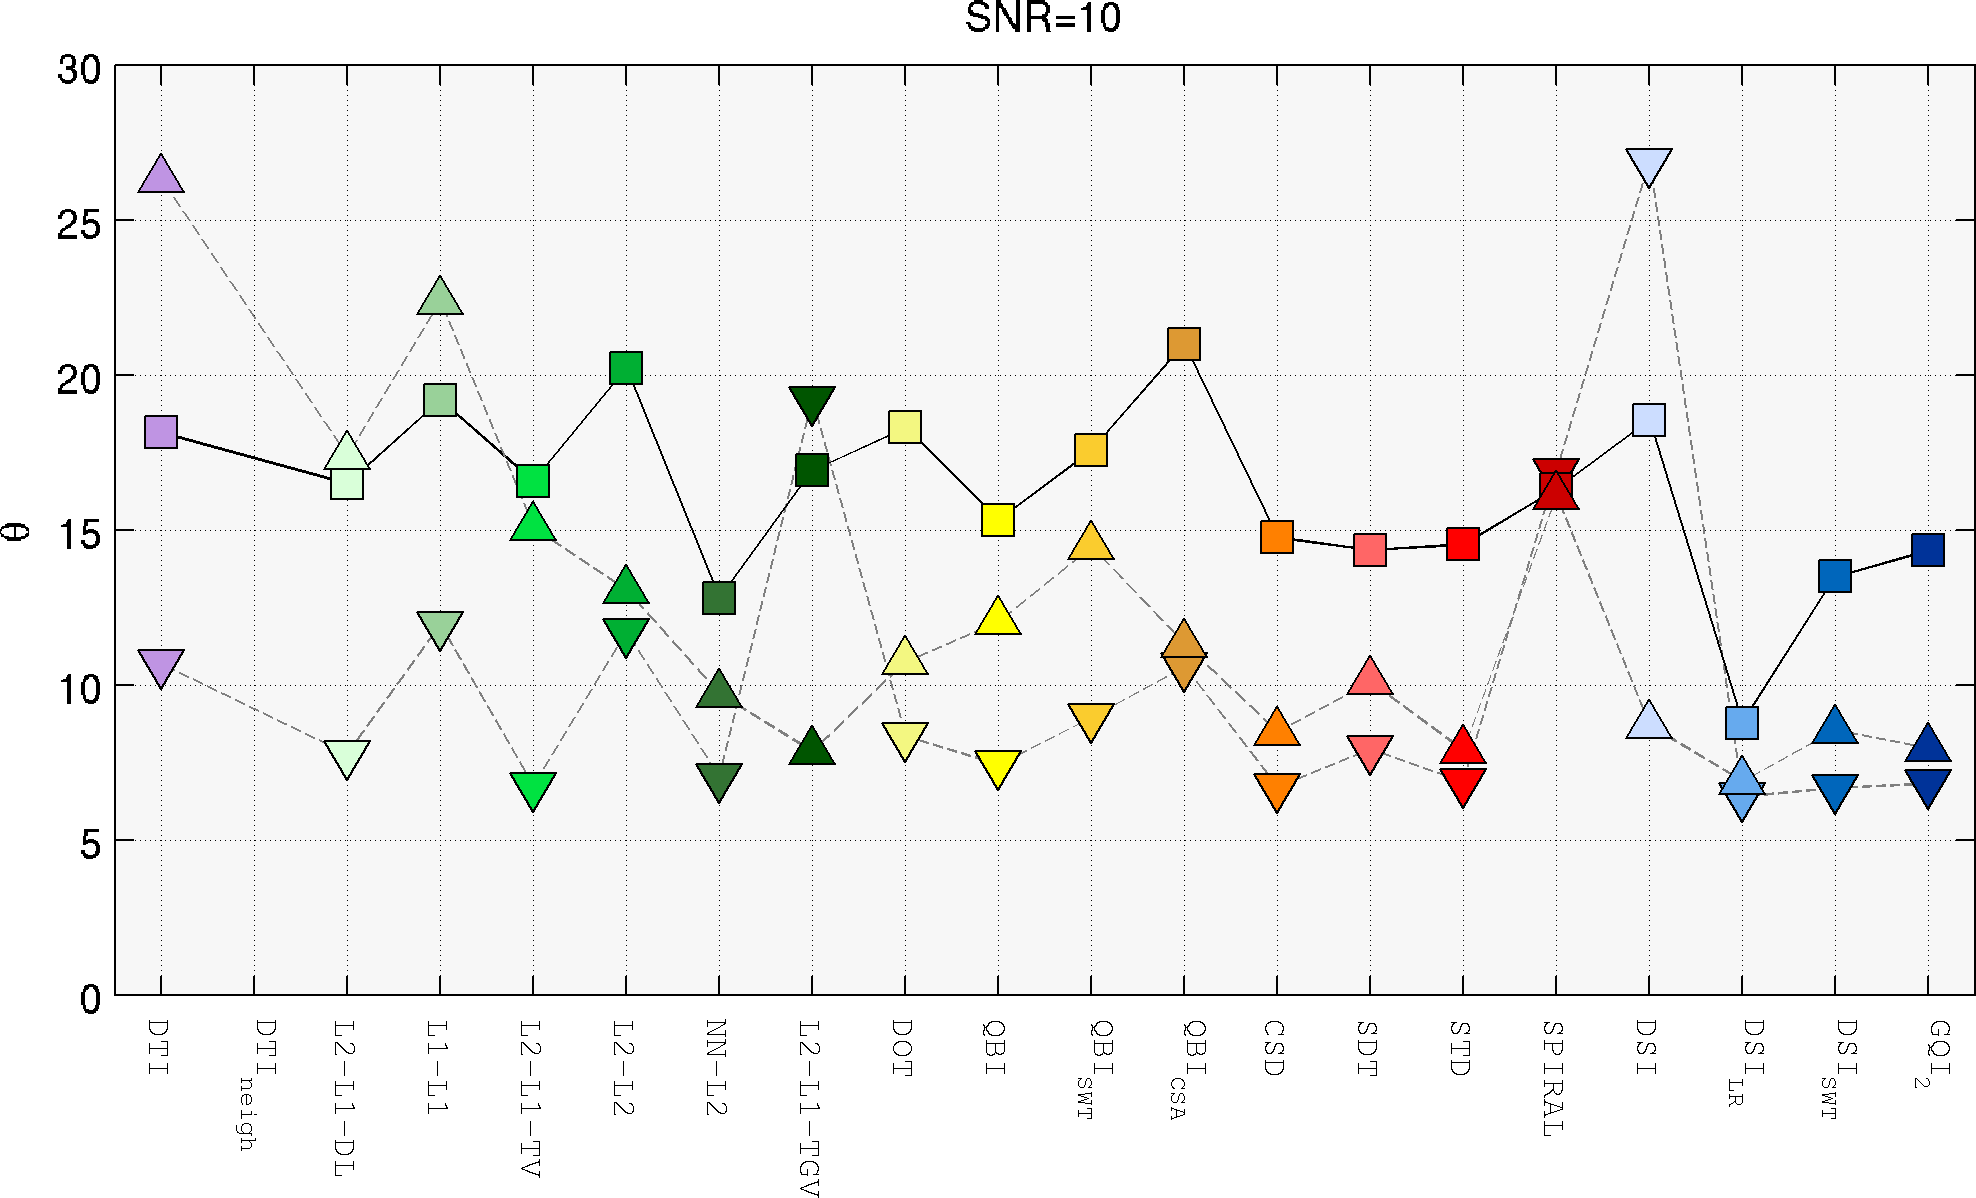
To help the reader in highlighting differences and similarities among the algorithms, the scores are also summarized in three separate ranges of crossing angles:  (downward triangles),
  (squares) and
  (upward triangles).